
Analyze your Dynamics 365 business processes with Power BI, and add its analytics to your Dynamics 365 dashboard
Microsoft has just released the new Process Analyzer Content Pack for Power BI for Dynamics 365 Version 8.2 and higher.
This content pack can help you monitor and analyze your business processes based on the detailed process information stored in your Dynamics 365 system. In this blog article, we’ll introduce this new content pack and show you how to get it, add a custom filter to one of its views, and embed the resulting visualization in your Dynamics 365 dashboard.
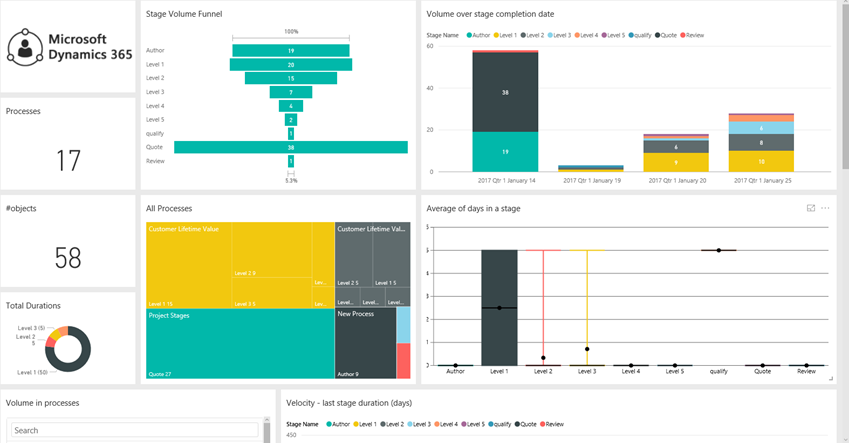
The content pack links directly to your Dynamics 365 database, creating interactive data visualizations that help provide insights into your business process flows. Track service performance with metrics like volume in processes with average duration in stage (broken down by stage), the process stage funnel, volume over stage completion date, and velocity through stages (with duration and days since completed).
In this blog post, we’ll walk you through several, increasingly customized and integrated, ways of working with this new content pack. The post is a bit long, so you can decide for yourself how deep you want to go. The stages we’ll cover are:
- Add the Process Analyzer Content Pack to your Power BI account
This will let you analyze and explore your business process data in the Power BI portal, using the default reports and dashboard provided by the content pack. - Embed the default Process Analyzer dashboard in Dynamics 365
This will bring the default business-process analytics into Dynamics 365, so you can monitor them each day without leaving Dynamics 365. - Create a personalized report and dashboard in Power BI
Create personalized business-process analytics that are most relevant to you and explore them using the Power BI portal - Embed and mix personalized business-process analytics in a Dynamics 365 dashboard
Create a custom Dynamics 365 dashboard that combines your personalized business-process analytics from Power BI with other types of customized Dynamics 365 information.
Add the Process Analyzer Content Pack to Power BI
To use the content pack, you must add it to your Power BI account and connect it to your Dynamics 365 instance as follows:
- Sign in to Power BI using the same account that you use in Office 365 and Dynamics 365.
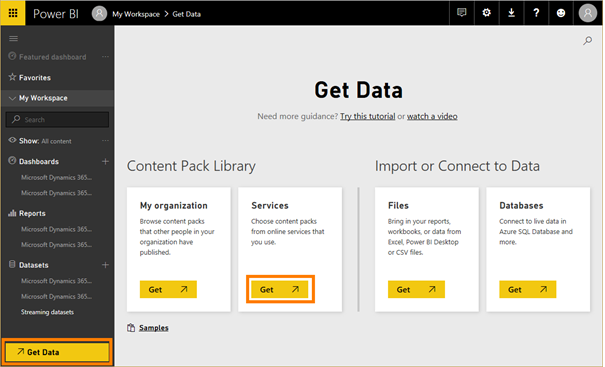
- Click Get Data at the bottom of the left navigation pane (click the Show navigation pane button
 at the left edge of the page if you don’t see the Get Data button).
- The Get Data page opens. From here, click the Get button under the Services.
- The AppSource dialog opens. Use the search form here to find the Microsoft Dynamics 365 Process Analyzer and click Get it now.

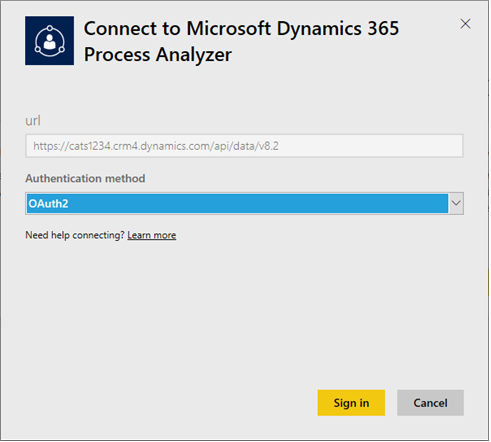
- The Connect to Microsoft Dynamics 365 Process Analyzer dialog opens. Enter the base domain name of your Dynamics 365 instance in the field provided (for example, “contoso.crm.dynamics.com”; don’t include “https://” or any path information).

- Click Next to continue. On the next page, set the Authentication method to OAuth2 and click Sign in.
- If an Office 365 sign-in window opens, then use the credentials you normally use to sign into Dynamics 365. Once you are signed in, you’ll return to Power BI and your Dynamics 365 data begins to load, which may take a few minutes.
- When the data is done loading, your Power BI navigation pane updates to show a new Dataset, Report and Dashboard in the left navigation column, each named after the Process Analyzer Content Pack.
- You have now added the new content pack and can start exploring the report and dashboard included with it.
Embed the default Process Analyzer dashboard in Dynamics 365
Let’s add the default Process Analyzer dashboard as a Dynamics 365 dashboard, so you’ll be able to monitor process analytics in the context of your daily work.
- Sign into Dynamics 365 using the same Office 365 account that you used to sign into Power BI.
- Go to any dashboard that you often use in Dynamics 365 (such as Sales > My Work > Dashboards).
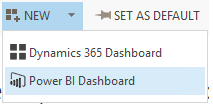
- In the toolbar, open the New menu and choose Dynamics Power BI Dashboard.
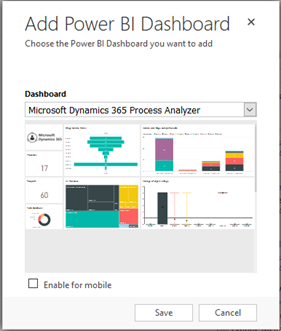
- The Add Power BI Dashboard dialog opens. From the Dashboard drop-down list, choose the Microsoft Dynamics 365 Process Analyzer and click Save.
- The full Process Analyzer Power BI dashboard is now available right in your Dynamics 365 workspace. Click on any of the tiles here to open a pop-up window that provides an interactive view of the original Process Analyzer Power BI report for you to explore.

Create a personalized business-process report and dashboard in Power BI
Out of the box, the Process Manager Content Pack shows analytics that include all the processes that you have set up in Dynamics 365. Let’s imagine that you’re a manager that is only interested in one specific process–power BI makes it easy to create a dashboard that is personalized just for you. Here’s how:
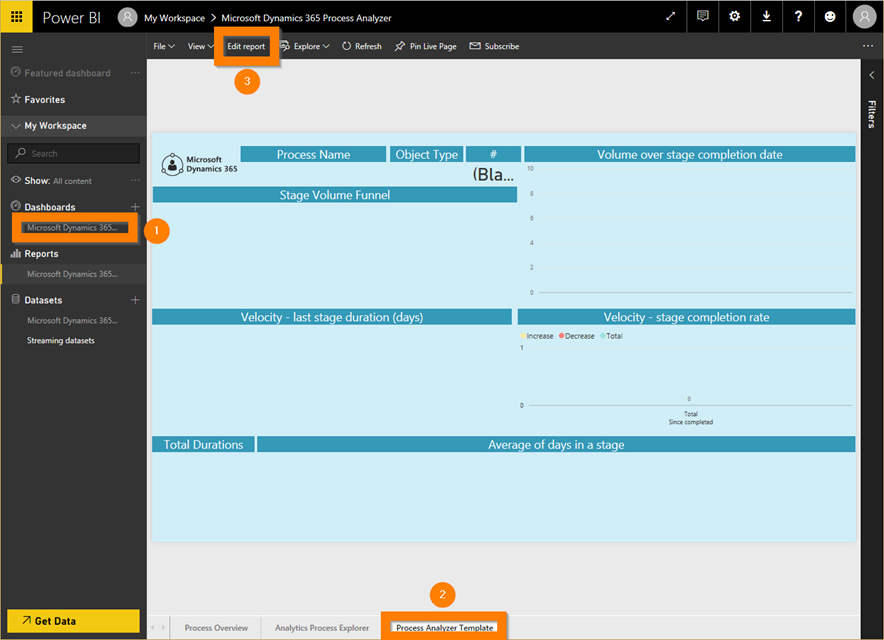
- Under the Reports heading in Power BI’s navigation pane, select the Process Manager report that you just added. Then select the Process Analyzer Template page (from the panel at the bottom of the report), and finally click on Edit Report in the toolbar at the top of the report. You now switch to the report-edit view.
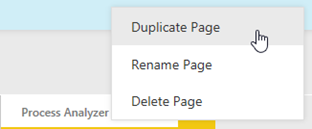
- The Process Analyzer Template provides a foundation for building your own process-specific reports, so we’ll start by making a copy of this template, and then customize the copy. Right-click on the Process Analyzer Template page name at the bottom of the page and then choose Duplicate Page from the pop-up menu.
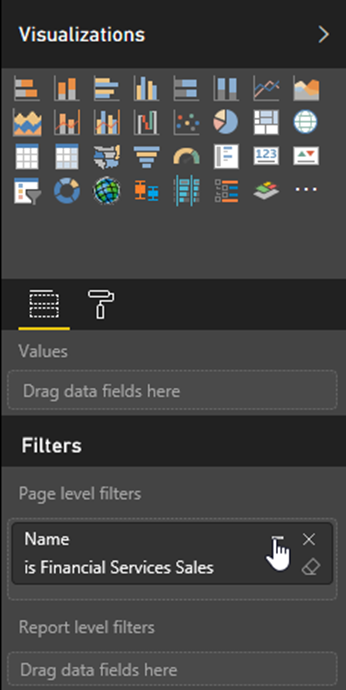
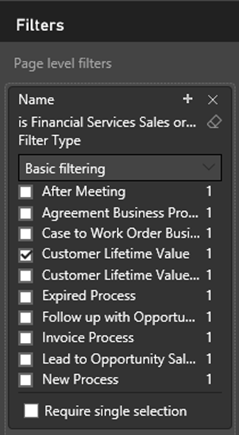
- With your new page selected, find the Filters heading in the Visualizations pane, which on the right side of the page; here you should see that there is a page-level filter called Name.
- Click on the Expand button for the Name filter (it looks like a hyphen; don’t click the delete-filter button, which is right next to it). The filter expands to show all the business-process names in use on your Dynamics 365 instance. Try marking the various checkboxes here and note how they affect the analytics shown in the main part of the screen. End by marking the checkbox for just one process name that shows interesting results. Your new page now provides analytics specific for your selected process only.
- Click Save
 in the toolbar at the top of the page to save your new report page.
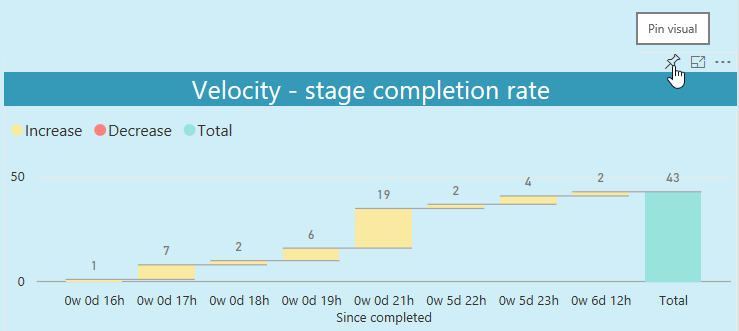
 - Hover your mouse pointer over one of the graphs from your new report page, and note the tile controls that appear in the upper-right corner of the tile. Choose a graph that you would like to include in your new dashboard and click on its Pin Visual button here.
- The Pin to dashboard dialog opens. Choose the New dashboard radio button and then enter a name for your new dashboard in the field provided. Click Pin to create the new dashboard and add your selected tile to it. Power BI dashboards make your visuals accessible from other systems, such as Dynamics 365, and we’ll be taking advantage of this later in the blog article.

- Using similar techniques, add a few more interesting visuals from your new, single-process report page to your new dashboard.
- Your new dashboard is shown under the Dashboard heading in the navigation pane.
Embed and mix personalized business-process analytics in a Dynamics 365 dashboard
Now that your personalized dashboard is set up in Power Bi and available for sharing, let’s add its visuals to a custom Dynamics 365 dashboard, where you’ll be able to see them more easily in the context of your daily work, and can mix them with other types of Dynamics 365 tiles.
- Sign into Dynamics 365 using the same Office 365 account that you used to sign into Power BI.
- Go to any dashboard view that you often use in Dynamics 365 (such as Sales > My Work > Dashboards).
- In the toolbar, open the New menu and choose Dynamics 365 Dashboard. (Note that you could also choose to create a Power BI Dashboard That option will load an entire Power BI Dashboard into a Dynamics 365 Dashboard all at once, but doesn’t let you add any other tiles or otherwise customize it in Dynamics 365.)

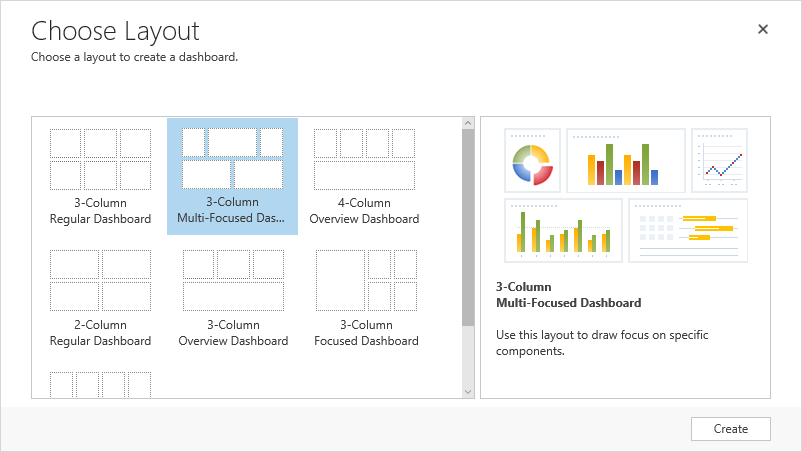
- The Choose Layout dialog opens. Choose any layout that has enough room for the tiles you want to add and then click Create.
- You now see a blank dashboard in Dynamics 365, with tiles arranged in the layout you chose. Each tile shows a collection of buttons in its center, which you can use to add actual tiles of various types to your layout. Choose a box in your layout and click on its Add a Power BI tile to the dashboard button.

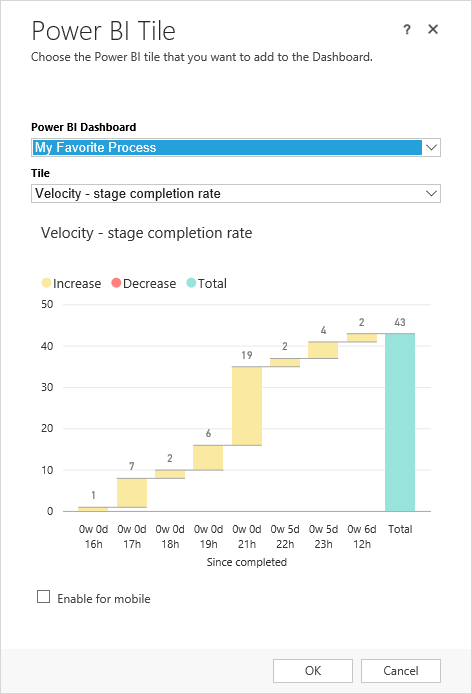
- The Power BI Tile dialog opens. From the Power BI Dashboard drop-down list, choose the name of the custom Power BI Dashboard that you just made. From the Tile drop-down list, choose the name of a tile from that dashboard that you want to add. Then click OK.
- The Power BI tile is now added to your dashboard. Using similar techniques, continue placing Power BI tiles on your dashboard however you’d like. You can also mix in other types of Dynamics 365 dashboards.
- Enter a name for your new dashboard in the Name field, then click Save and Close in the toolbar. Your new dashboard is now ready for use.

Resources and more information
To learn more about the topics raised in this blog post, and to find related resources, see the following:
- Try Power BI
- Learn Power BI
- Microsoft Dynamics 365 content pack for Power BI
- Customize Microsoft Dynamics 365 Power BI content packs
If you’re an advanced user, and would like to open, analyze, and customize this content pack in detail using the Power BI desktop app, then you can download the Process Analyzer Content Pack here.
We’d like to credit the co-authors on this, and give contact details for Christian, who would like to interact with customers and partners who use this content pack. Here are author details:
Christian Abeln
Senior Program Manager, Microsoft
Email: Christian.Abeln@microsoft.com
Karl Maybach
Senior Content Developer, Microsoft