
Analyzing Customer Insights data with Power BI
Applies to: Dynamics 365 for Customer Insights July 2017 Update
With the July update, Dynamics 365 for Customer Insights (DCI) has made available a new Power BI connector. Now, aggregated and enriched data in DCI can be analyzed in Power BI using the new Power BI connector. This allows combining the analytic power of DCI with data visualization and exploration capabilities of Power BI to get best of the both the worlds. KPIs and profiles data can now be easily extracted into Power BI Desktop to build Power BI reports. These reports can then be shared with other users using the Power BI service.
You can build advanced data visualization over Profile or KPI data using Power BI visualizations such as geo-maps or treemaps with interactive drill-down and filtering capabilities.
Note: The Power BI connector like Dynamics 365 for Customer Insights is a preview feature.
Power BI connector provides an integrate experience to author Power BI reports with DCI data in Power BI Desktop. To connect to DCI in Power BI Desktop, go to Get Data -> Online Services and select Dynamics 365 for Customer Insights (Beta) from Online Services list.
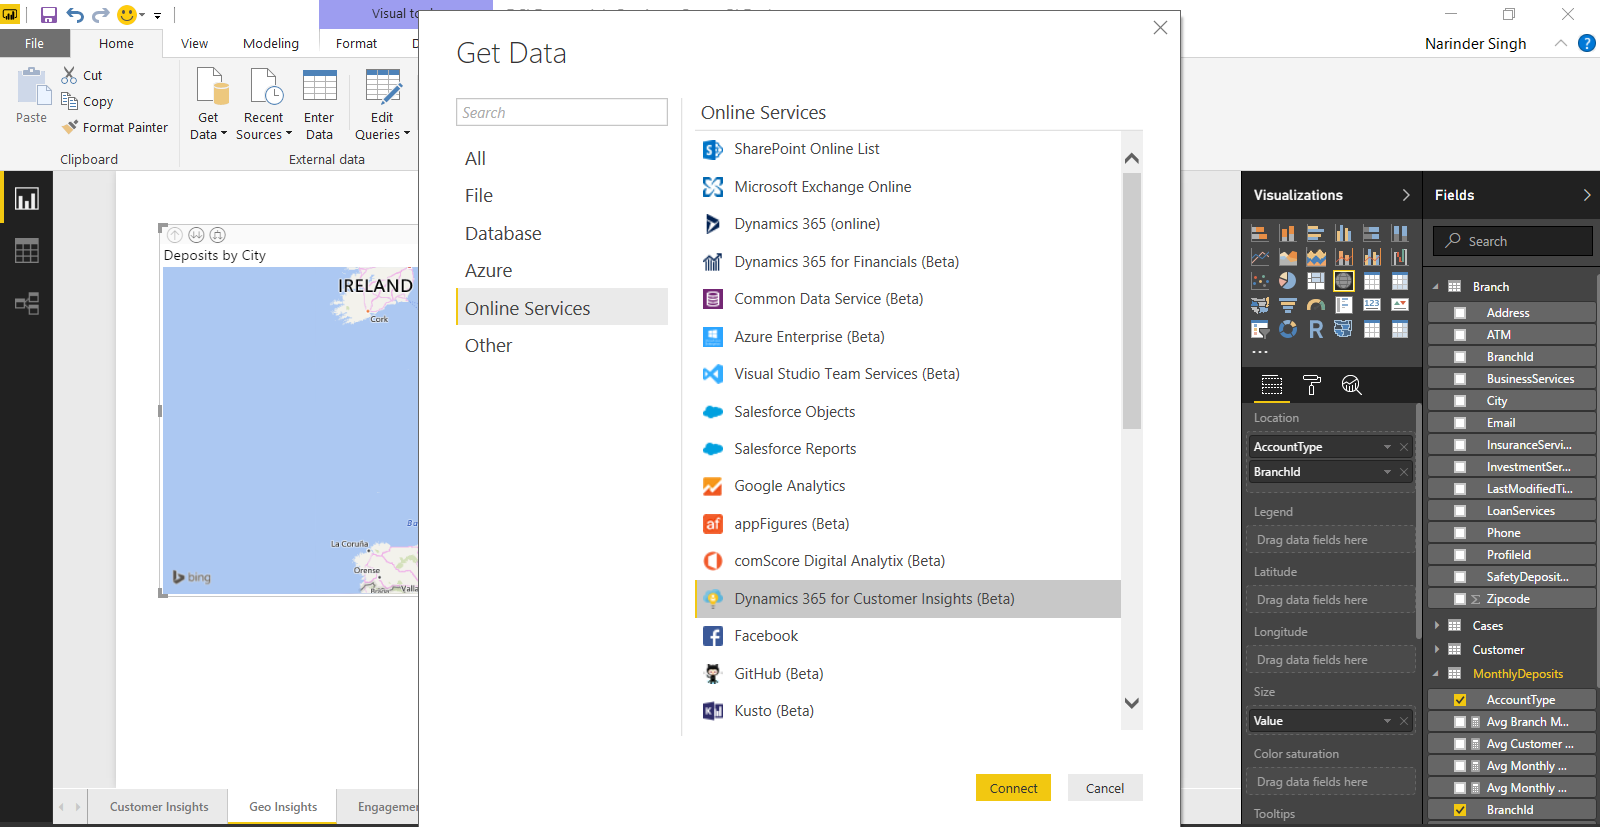
Figure 1 – Connect to DCI
Note: You can get the API endpoint URL by going to DCI hub in Azure portal under service overview blade. It follows the pattern https://<hubname>.api.azurecustomerinsights.com
Next, provide the DCI hub API endpoint URL.

Figure 2 – Enter API URL Endpoint
Authenticate by supplying your DCI hub login credentials and voila all the KPIs and Profiles are available for you to start authoring power queries.
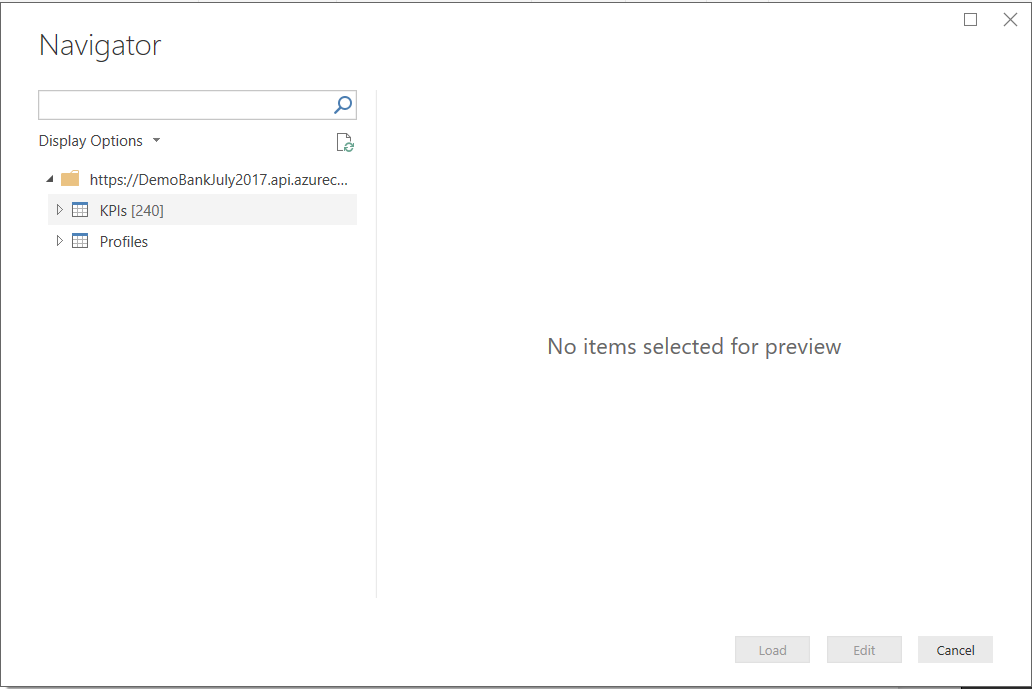
Figure 3 – Select KPI or profile to build power query
You can then start building the Power BI model by connecting KPIs and profiles to enable interactive slicing/dicing and drill-down by KPI group by or profile attributes in your Power BI report.
The diagrams below show an example model that I prepared by connecting MonthlyDeposits KPI and connecting its group by attributes BranchId and CustomerId with corresponding profiles, Customer and Branch.
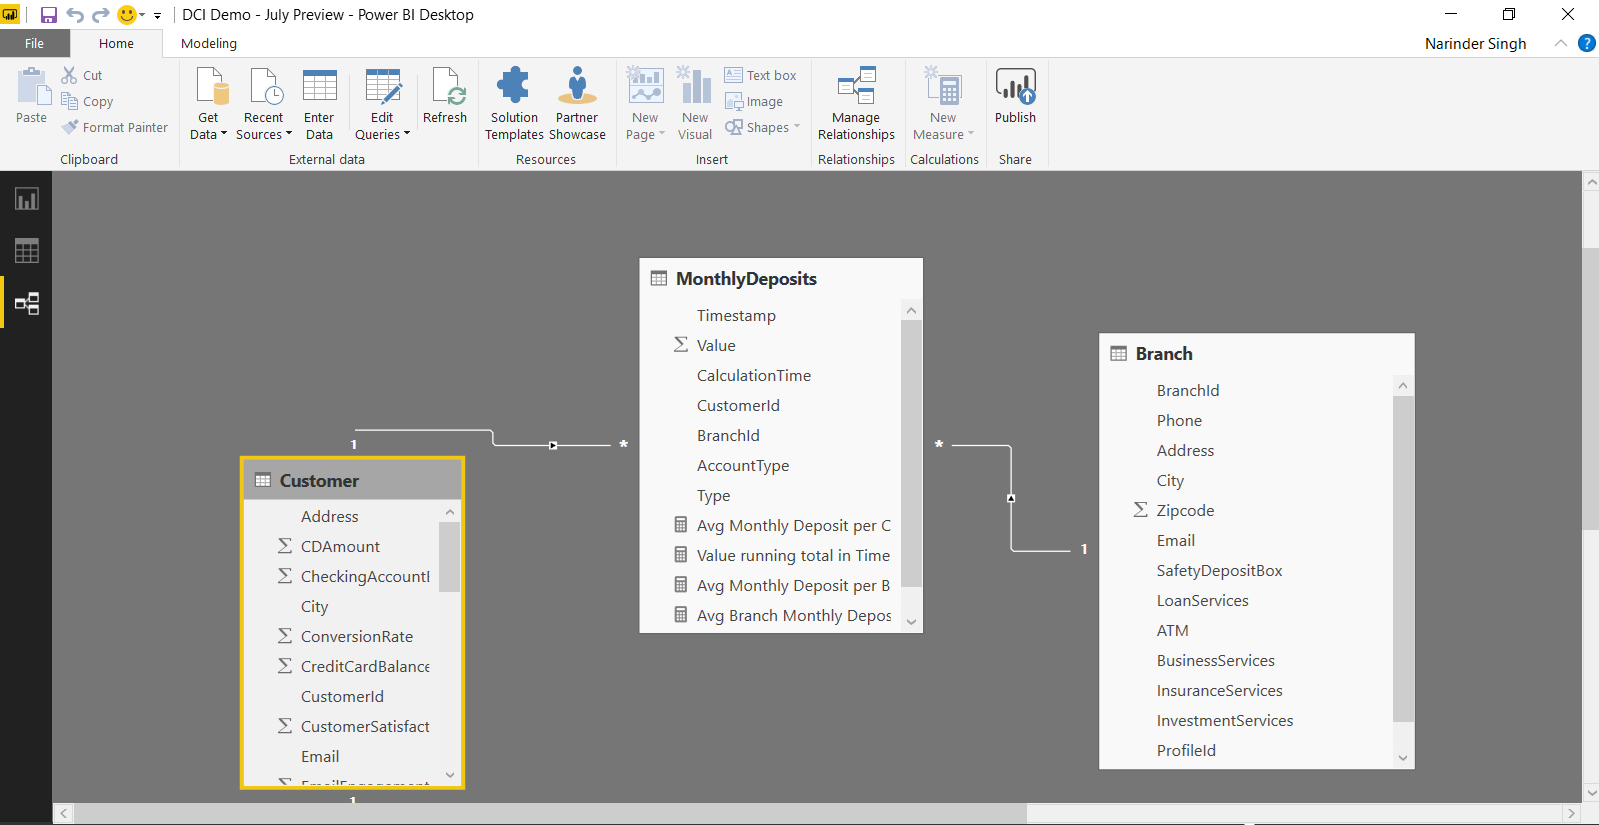
Figure 4 – Model build with KPI and Profiles
With such a model, you can interactively slice and dice the MonthlyDeposit KPI by any Profile or Branch attribute in a Power BI report.
Then I quickly built a Power BI report shown below, with which you can slice the Monthly Deposit KPI by time of deposit and view the deposit by Account Type and City locations where deposits were made.
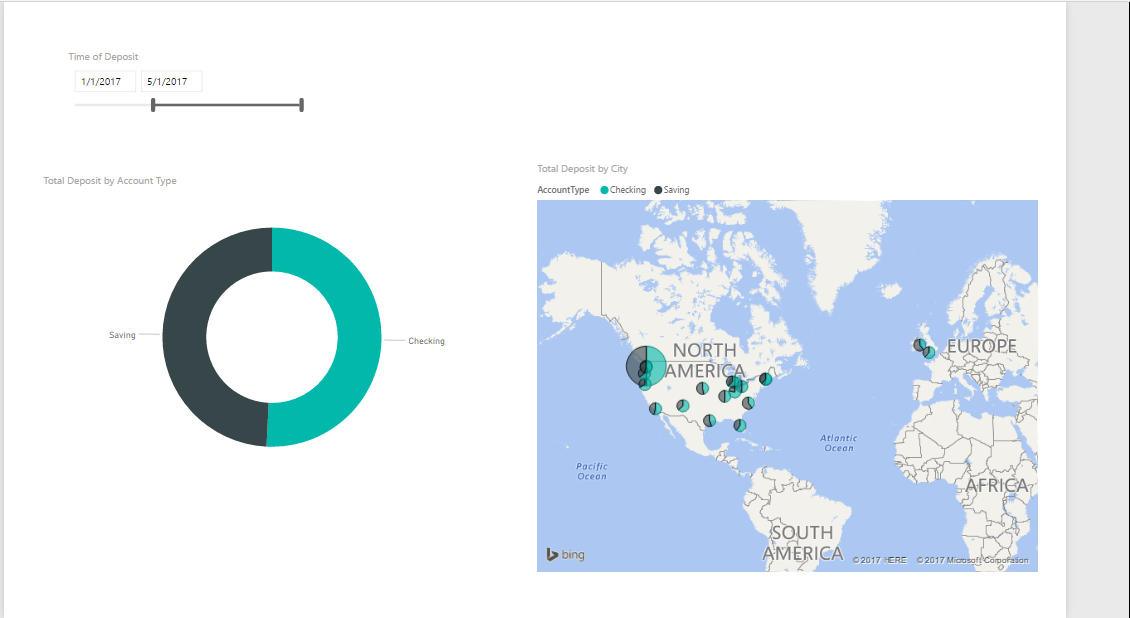
Figure 5 – Power BI report
Now, you have the full power of Power BI at your disposal to harness the data visualization and exploration capabilities combined with big data and predictive analytics capabilities of DCI. Start exploring this new connector and let us know how it goes. We would love to hear your feedback on how to improve it further.
Useful Links
- Documentation for the Power BI connector is available here.
- Get started documentation for Customer Insights is available here
Narinder Singh
Principal Program Manager
Microsoft Dynamics 365