Using Power Platform Dataflows to extract and process data from Business Central – Post 1
How do you get data out of Business Central so that you can use it in other systems? For example, how can you visualize Business Central data in Power BI or analyze it in Azure Databricks?
The main way to get data out of Business Central (and in again for that matter) is through the API endpoint at https://api.businesscentral.dynamics.com/v2.0/production/api/v1.0. This works well in many cases, but it also has some shortcomings; especially around performance: Whenever you call an API, the Business Central service creates a short-lived session for you, run some AL code, get some data from a database, run some more AL code, serialize the results to json, and return it to you.
There are many things going on, and invariably it will never be as efficient as if you accessed the data directly in the database. This also impacts how you can use the data – it becomes less appealing to do exploratory analysis on the data where you don’t know up front exactly which data you will need. Note, that there are good reasons why we don’t allow customers to access the database directly. A main reason is security; Business Central must enforce access control to the data, i.e., respect the permissions of the user who is trying to access the data, and this requires running code.
This blog post is the first in a short series of blog posts, which explore using Power Platform Dataflows to get data out of Business Central – through the API – to subsequently allow customers and partners to do arbitrary and efficient analysis on that data.
You manage Power Platform Dataflows inside the Power BI website, and this also illustrates that a main “consumer” of Dataflows is – Power BI. In the first two blog posts of this short series, we will explore how to use Dataflows with just one purpose; to analyze and visualize the data in Power BI. In the third blog post, we will then set the data truly free, which allows innumerable scenarios on top of the data, including analyzing it in Azure Databricks, copying it to Azure Data Warehouse, etc.
In this first blog post, we take the first steps by simply looking at how you can visualize Business Central data in Power BI using the Business Central API. The result can be illustrated like this:

This serves as a stepping stone for when we introduce Dataflows in the second blog post.
APIs in Business Central are based on the OData standard
The Business Central API is based on the OData standard, which is a standard that is understood by many products including Power BI.
The API can be accessed at https://api.businesscentral.dynamics.com/v2.0/production/api/v1.0, where “production” is the name of the environment. Many customers also have a “sandbox” environment, but the name of an environment can be anything the customer chooses.
Business Central data typically lives in the context of a company, and our starting point will also be “company” entity. We can access companies on this URL:
https://api.businesscentral.dynamics.com/v2.0/production/api/v1.0/companies
From here, we can navigate to more interesting entities.
Querying Business Central APIs in Power BI Desktop
Power BI is an online service that you can access at https://powerbi.microsoft.com. You can do much authoring and exploration of data here, without ever leaving the browser.
There is also a very powerful desktop application – Power BI Desktop – that enables more advanced authoring of datasets and reports. Once you have created a nice report with Power BI Desktop, you can upload it to Power BI online where you can then view, explore, and share the results.
In this blog post, we will use Power BI Desktop, which can be downloaded at https://powerbi.microsoft.com/desktop.
Inside Power BI Desktop, we can access the Business Central API using the URL listed above. Start by clicking “Get Data” and locate the “OData Feed”, and then click “Connect”:
Now, paste in the URL that we had earlier:

The easiest and most secure way to authenticate to Business Central is by using “Organizational account”. Select that and click “Sign in” to sign in with your Azure Active Directory account. Once logged in, the screen changes to this:

After clicking “Connect”, Power BI Desktop will call Business Central to get a list of companies back:

Since the companies themselves are not the main interest for us, we need to click the Transform Data button, which opens up the Power Query editor:
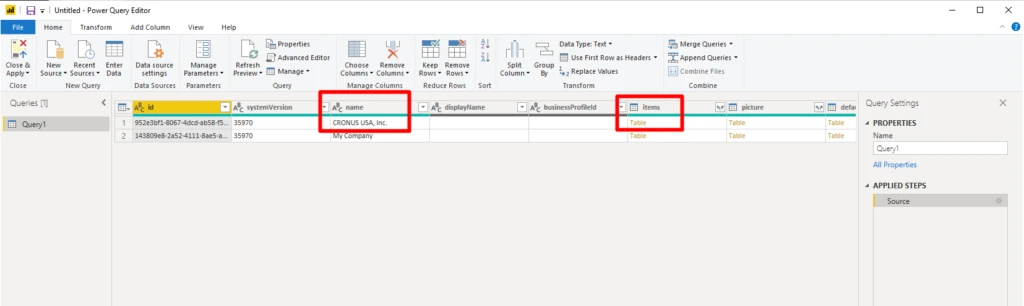
Here we can see all the entities that are exposed, for example “items”, “picture”, “defaultDimensions”, “customers”, “vendors”, etc.
Click the Table link for, for example, items.
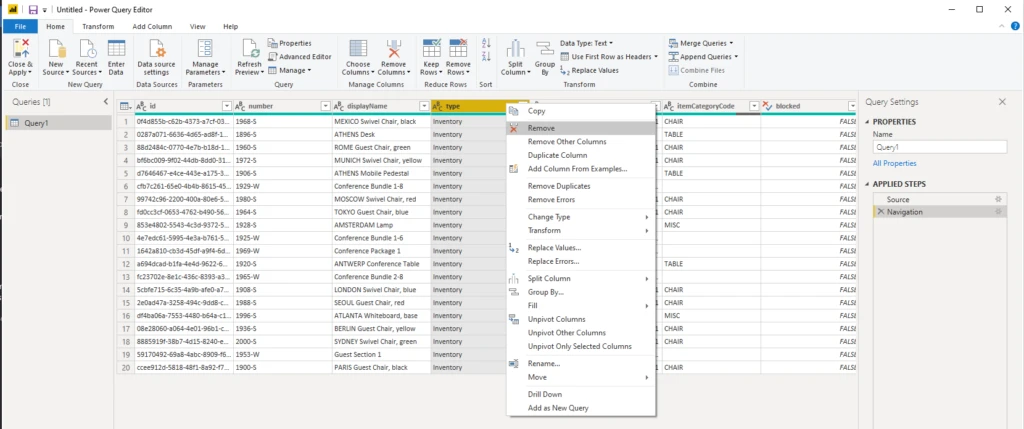
You can choose to make additional transformations (filtering, calculations, splitting, grouping, etc.) of the data right here. We will remove the “type” column, and we will rename the query from “Query1” to “Items”. We will not go into details on the capabilities of Power Query – you can read more about the capabilities at https://docs.microsoft.com/en-us/power-query/power-query-quickstart-using-power-bi.
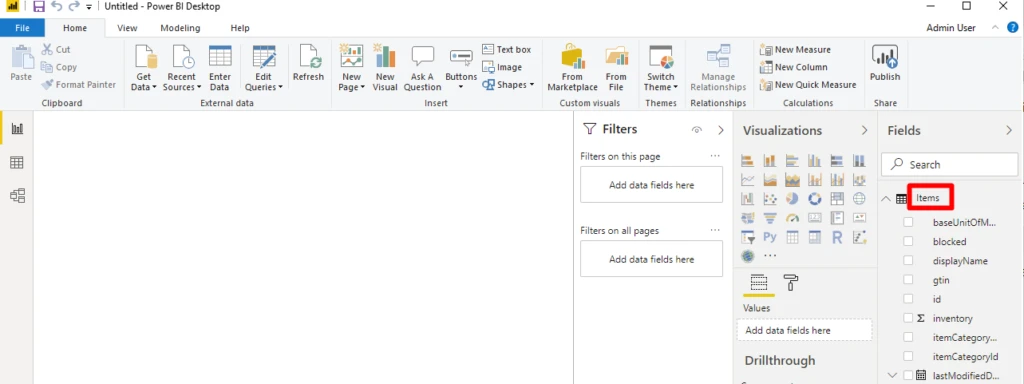
Click “Close & Apply” when you are done. You will notice that a new “Items” data source has appeared in Power BI Desktop:
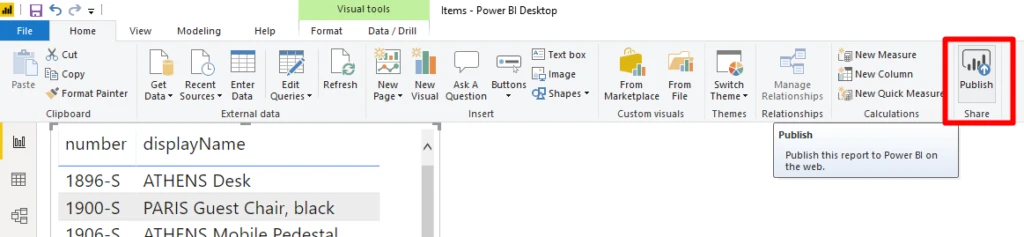
Let’s make a quick visualization of some data. If you click the “number” and “displayName” fields, you will get a table that looks like this:
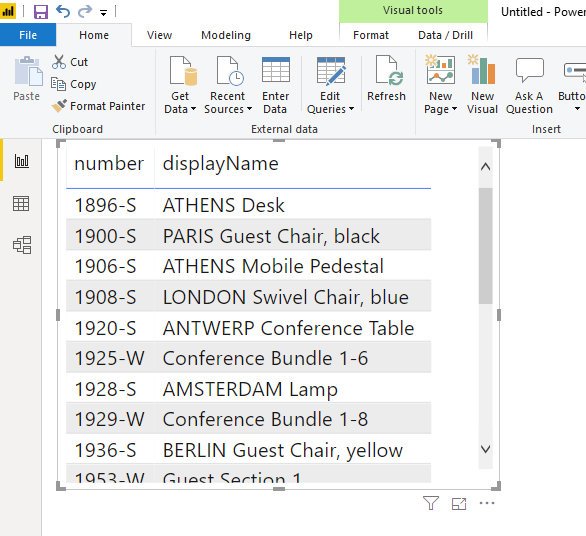
Since this blog post is not about Power BI as such, we will keep it at this simple visualization. We will save the report to a file Items.pbix. Next step is to move it to Power BI online.
Uploading the report to Power BI online
Power BI online is organized in so-called “workspaces”. Each user has a personal workspace called “My workspace”. This is where we will upload the report that we just created.
There are different ways to upload the report, both from Power BI online and from Power BI Desktop. We will do it from Power BI Desktop.
First, you need to log into Power BI Desktop with your Azure Active Directory account. Click “Sign in” in the upper right corner, enter your email address and your password.
Now you can click the “Publish” button:
Select “My workspace”, and soon you should see this message:
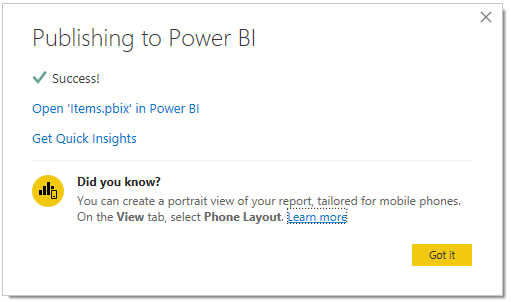
If you log into Power BI online, you should see that “My workspace” now has some new elements; a report and a dataset. Your report looks the same as it did in Power BI Desktop:

If you have changed the data in Business Central and want it refreshed in Power BI, you can click “Refresh now” on the dataset:

However, since Power BI online doesn’t have your credentials, you will be prompted to log in before the data can be refreshed. You can obviously also configure scheduled refresh.
This first blog post showed how we can connect Power BI to the APIs of Business Central. The setup we ended with can be illustrated like this:

The dataset has a private data store, and we can refresh the data in that data store either manually or on a schedule. Reports can visualize the data in datasets.
In the next blog post, we will introduce Power Platform Dataflows and expand on the setup that we created in this blog post.