
AI models for topic discovery in Customer Service Insights
As mentioned in our previous blog post Advanced AI topic clustering in Customer Service Insights, we’re publishing a series of “AI inside-out” blog posts to cover the key areas on how AI works in Dynamics 365 Customer Service Insights.
One of the key AI features that Customer Service Insights supports is automatically grouping similar support cases into topics. This is achieved with an AI methodology called clustering. In this post, we’ll look at how clustering works and explain the advantages of using clustering over some other techniques used for topic discovery.
What is clustering
At the very high-level, Customer Service Insights uses clustering as the way to discover topics. Clustering groups together objects (cases) within groups. The idea is that the objects within a group are more similar to each other than they are to objects in other groups.
Imagine each customer support case is represented by a point on a plane and the distance between these points represent how “similar” these cases are. Then our set of cases could look something like this:

Figure 1: An example of cases scattered in the data “universe”
In one of our next posts we will explain how the semantic similarity of text data in customer support cases is translated into the distance between points. For now, we will just say that we use a common technique called sentence embeddings (we will explain this terminology in future posts as well).
After applying clustering analysis to the above dataset, we could get the following 2 clusters:
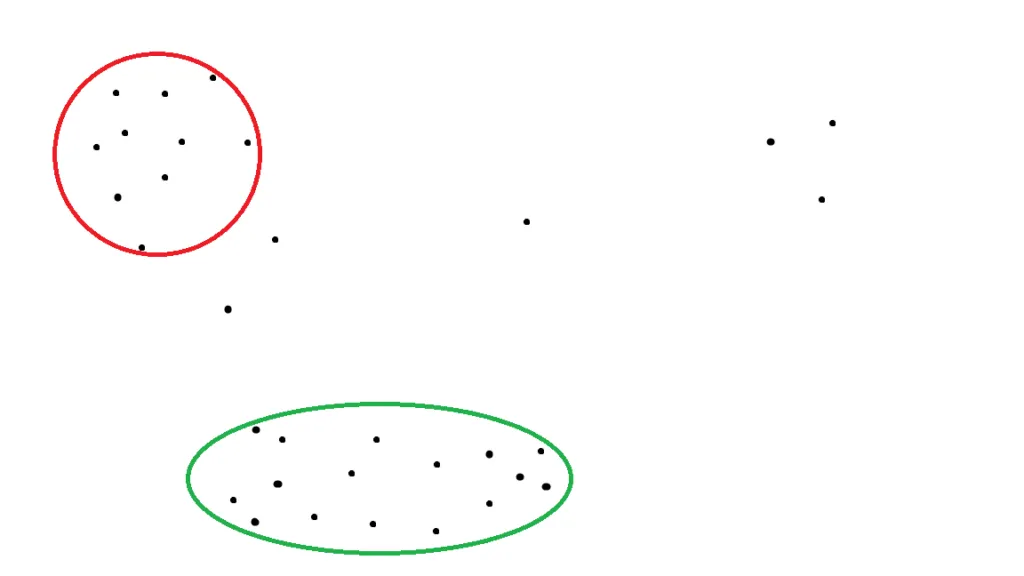
Figure 2: Clustering cases into different groups
Once we identify the clusters, each cluster forms a topic. All items in each of these two topics (the red and green circles) are relatively similar to other items in that cluster. When you click on a topic in Customer Service Insights reports, you can see the Topic Details Dashboard from which you can navigate to a list of cases that belong to a cluster.
Clustering algorithms
Clustering analysis is a well-known problem in unsupervised learning. There is no single “correct” clustering outcome, because there are multiple ways to group cases into clusters, depending on requirements. There are many clustering algorithms with different strengths and weakness (for more detailed taxonomy, see the Wikipedia article on cluster analysis).
Algorithms differ in approach to how they group items together, in the number and type of required parameters and in computation speed. For example, in perhaps the most famous clustering algorithm, K-Means clustering, takes only one parameter: the resulting number of clusters. This may be desired for some applications, but not acceptable for others.
In topic discovery application we don’t know in advance the number of topics present in the data. We also want clusters with a significant number of cases and clusters where cases are very similar to each other. For these reasons, we chose to use another well-known clustering algorithm called DBSCAN as a foundation for our clustering algorithm.
In a nutshell, DBSCAN works by identifying contiguous regions with some minimal sample density and making each of these regions a separate cluster. More formally, the algorithm requires just two parameters to operate: distance threshold, and the minimal number of points within that threshold to meet a density requirement. DBSCAN does not take the number of expected clusters as a parameter, but instead infers this information from the data itself. This is an important property which allows us to discover the number of topics in the data and communicate this.
More problems we had to overcome
At the first glance clustering analysis appears to be a very appealing approach as it can generate insights from the customer’s data without any effort from the customer. And, indeed, it is a very powerful technology; however, to make it really work smoothly in an enterprise environment the Customer Service Insights team had to take a series of steps and implement a number of enhancements on top of text-book algorithms.
The three major areas where we have invested are:
- Topic stability
- The ability to receive feedback
- Computational complexity (speed and cost)
Topic stability
If data changes (sometimes just a little) the clustering algorithm may result in a significantly different set of clusters.
Also, even if the clustering algorithm has discovered a set of topics which are semantically the same as the topics that were discovered two months ago, it may not be trivial to understand which topic relates to which because all the data items that form these topics have changed.
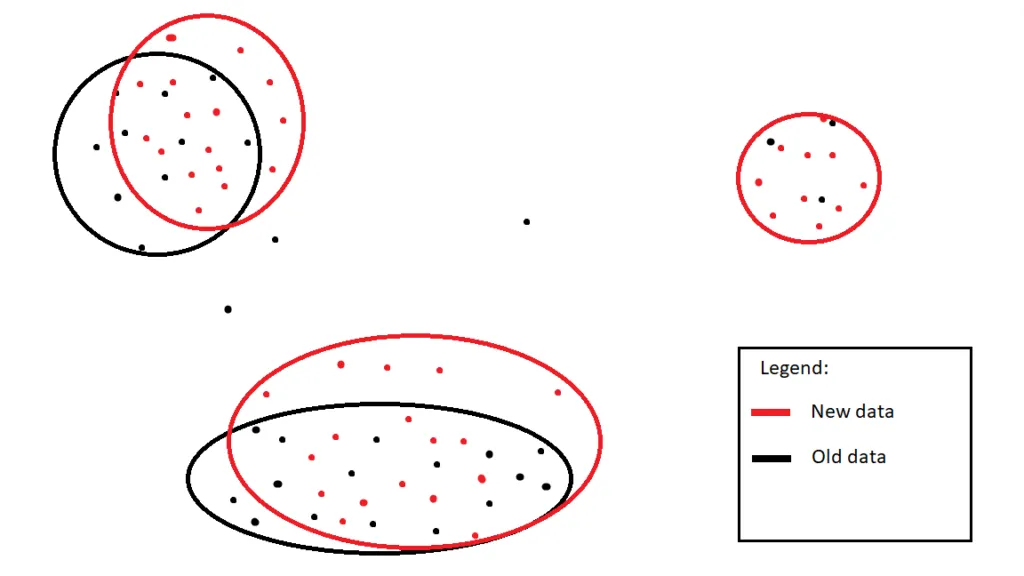
Figure 3: Stabilizing clusters with case data changes
To solve the two problems above we had again to move from text representation into a vector space of sentence embeddings and analyze how the spaces from different topics overlap. With this approach we were able to solve problems for most of the practical situations. If the overlap is significant we keep the original cluster and all information associated with it (name, feedback), however if the overlap is small or nonexistent we can identify it as a new cluster.
Feedback
As humans, we almost always can see more than one way to group a set of cases into a logical set of topics, depending on personal preferences and business goals. Sometimes, after topics were discovered, the customer may want to change the topics according to their preferences. One of the great features of Customer Service Insights is the ability to collect feedback for the clustering algorithm. When a customer sees the result of clustering they can “thumb up” or “thumb down” items by clicking them.
Under the hood, the clustering algorithm finds items that are similar to the items for which the customer has provided feedback and uses that information to cluster these similar items as well. This way of providing feedback is very intuitive and powerful at the same time: with just a few clicks customers can make significant changes to the outcome of clustering and get the topics they want.
Computational complexity
The power of a clustering algorithm comes at a high cost of computational resources required to do the clustering. In computer science the computational cost of algorithms is traditionally described by O(N) notation. For example, if an algorithm is said to be O(N2) it means that the number of operations it takes to process a dataset of size N is proportional to N2. As another example, a typical algorithm that sorts an array of N elements is O(N*log(N)).
In other words, O(N) notation characterizes how fast the computational complexity grows with the growth of the dataset.
For the DBSCAN algorithm in a generic case, the complexity is O(N2). This is not a problem if we have just a few hundred or a thousand items to cluster. However, if we have a million cases to cluster the computation cost can be prohibitively high (it is 1 million times more consuming to cluster 1 million items than 1 thousand items).
To overcome this issue we had to implement a series of optimizations that essentially improve the complexity of our algorithm from O(N2) to approximately O(N) assuming the constant number of topics, making it possible to cluster millions of cases within a reasonable timeframe.
Why clustering is better than alternatives
Clustering is not the only way to discover topics. A famous approach to this problem is called topic modeling, which is used in a variety of applications; LDA (Latent Dirichlet Allocation) probably being the most well-known implementation of the topic model.
LDA is a mixture model, where each document probabilistically belongs to multiple topics at the same time. Topics, in turn, are defined not by a set of documents, but by a set of weights expressing how much each document belongs to each topic.
This approach has some advantages in terms of flexibility. If a case covers several topics, we don’t have to artificially attribute it to just one topic, but can cover all the topics it actually represents.
In practice, some of the most important requirements for Customer Service Insights are transparency and interpretability. We want not just to discover high quality topics, but also allow customers to easily understand what these topics are. From that perspective, we found the hard clustering approach to be more powerful: we simply attribute each case to one of the topics and this way customers can simply see the cases that form a topic (as a bonus, they can also provide feedback!). That is why Customer Service Insights uses clustering instead of LDA.
Next steps
In this post we gave a high-level overview of how Customer Service Insights discovers and represents topics from customer support cases with clustering. In the next post, we will provide an overview of one of the key technologies that was just briefly mentioned in today’s post: sentence embeddings.
As always, your feedback is critical for us to prioritize what’s next. If you have any suggestions or ideas, please don’t hesitate to submit an idea or vote on others’ ideas.
If you have questions about this support or any other features, we’re always available at the Customer Service Insights forum to help you.
To learn more, visit:
- Dynamics 365 Customer Service Insights: https://aka.ms/CSInsights