Best practices for building an effective fraud scorecard
One of the most important aspects of fraud prevention is to know where you stand in the fight against fraud. An effective fraud scorecard makes you aware of current trends, helps identify any evolving problem areas, and empowers you to make decisions as an organization. Striking the right balance is important. Too much detail can drop adoption or cause you to miss unforeseen issues due to information paralysis. Too few details won’t deliver actionable insights, rendering the scorecard ineffective.
One way to strike that balance is to design a layered scorecard that is crisp, insightful, and appealing to all audiences.
Define the goal of the scorecard
Before you get started, you should know the answers to these questions:
- What is the scorecard supposed to say and to whom?
- Is it meant for consumption by senior management?
- Should it cater to analysts and fraud managers?
- Should it provide the ability to do deep analysis and define rules?
When any new patterns are found during investigations, it’s tempting to add additional views to the existing scorecard. Over time, such additions will bloat the scorecard and deplete its overall effectiveness. Defining a goal in advance and sticking to it will help to ensure that the value of the fraud scorecard remains intact.
After the goal is defined, the layers for a fraud scorecard can be carved out. Typically, three layers work best to offer insights that cater to different levels of consumers.
First layer: Exec summary
The purpose of this layer is to show the business impact as a snapshot. A view that can be taken as-is into executive review slides. Include only a few uber-level metrics. Profit efficiency, which measures overall impact from fraud, non-fraud, and optimization, should be the main metric in this view. Customer impact metrics, such as escalations or false positives and a split of fraud detected by automated system versus human reviews, can also be included. Representing these metrics as snapshots for a specific time, month, or week, and color coding them to measure against target or change from a previous time period will emphasize the goal of this view.
Second layer: Contributors
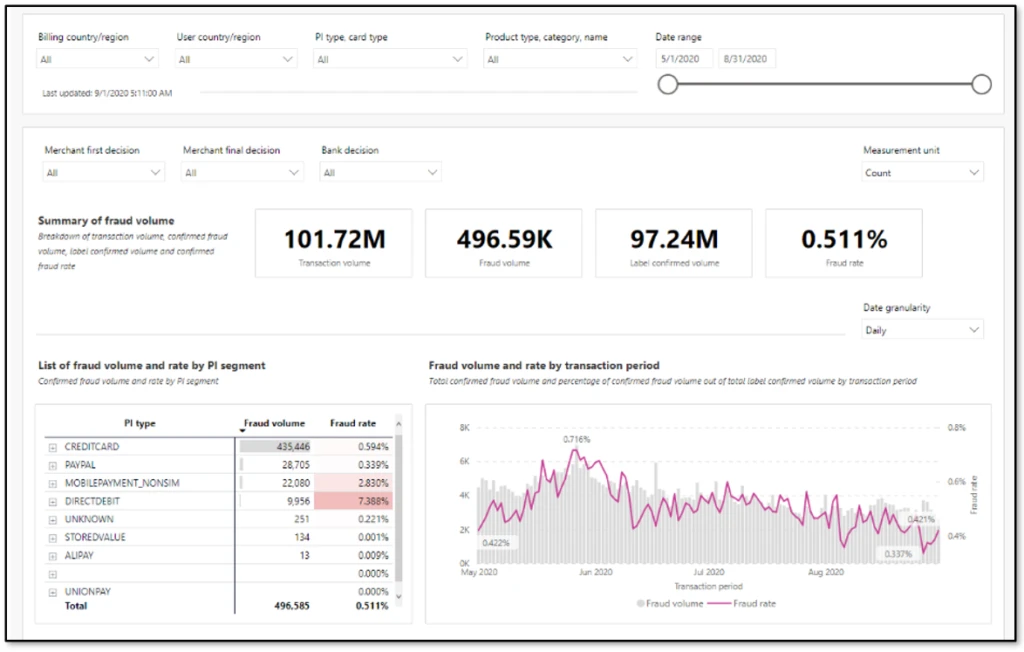
This layer should show what the current trends are and what is contributing to any changes in uber-level metrics. This will be the key monitor for fraud managers and the starting point for analysts. A trended view of key metrics, such as fraud rate, split by chargeback and other sources, rejection rate, top rules that were executed, challenge rate, and refund rate can be included here. Representing these as trend charts, with the ability to look back a few months, will make these most insightful.

Third layer: Drivers
This layer offers deep dive views on causation. Analysts can rely on this view to quickly identify drivers for any changing trends and react to evolving fraud patterns. Score distribution and respective fraud rates, segmentation slices such as geo-product-payment type can be included. If there are certain thresholds implemented to deter abuse, such as a maximum of five orders per month per user, then views can be added here to track users who are hovering just below the threshold.
Things to avoid in a fraud scorecard
It is important to not use a fraud scorecard as an investigative tool. A scorecard is meant to provide an aggregate view of where things stand, like the dashboard of a car. Investigations will require specific data at transaction level. Having the ability to slice data in multiple forms and link across transactions is quintessential for investigations. Trying to build one tool for both purposes can easily lead to large amounts of data, which slows down performance and dilutes value. Except for certain cases where you are using specialized Power BI and data exploratory tools, it’s always best to keep a fraud scorecard separate from investigative tools.
Next steps
If you’re already using Dynamics 365 Fraud Protection, use the account protection and purchase protection scorecards to gain business insights. Additionally, as described in our earlier post Do you monitor the pulse of your fraud protection operations?, you can also export transactional data into your existing workflows to augment your business-specific reports.
If you aren’t already using Dynamics 365 Fraud Protection, sign up for a live demo or a free trial to check out this and other capabilities that can help your business develop effective fraud protection strategies.


