AX for Retail 2012 R2: Run-down on Log Files
Logging and tracing has changed quite a bit between AX for Retail 2009 and 2012 R2 so an updated version of my AX for Retail: Run-down on Log Files article is somewhat overdue. Hopefully this will be a quick reference guide that you can use for all Retail components.
Retail POS
This is the component that has changed the most in 2012 R2. In previous versions you set the logging level in the Functionality Profile and messages were saved to a table in the POS database (POSISLOG or RETAILLOG). POS logging is now configured directly in the POS.exe.config file and is very similar to the logging we introduced for the Retail Transaction Service in 2012 R1.
Open the POS.exe.config file in your favorite text editor. The first thing you will notice is that this file has about twenty times more content in it than previous versions. Most of the new sections deal with calls to the Real-time Service (which is now a Web Service). The logging section we are interested is in the <system.diagnostics> node. You will note that there are two trace listeners defined:
<source name=”RetailNetTracer” switchValue=”Warning”>
and
<source name=”RetailNetTracerEventLog” switchValue=”Error”>
Retail POS now logs detailed error messages to the standard Windows Event Log which you can view using the familiar Windows Event Viewer. This is the first place that you should look when your POS users are reporting problems with the application. You can always leave this switchValue as “Error”; regardless of its setting we do not log Warning or Information messages to the event log.
In order to get those Warning and Information messages you need to change the values for the RetailNetTracer listener. There are two things you can change: logging level and log file location.
Line 11: Change the switchValue to “All” to get all messages (if you’re digging into a problem I wouldn’t bother with anything besides “All”). Note that this value is case-sensitive.
Line 27: Change the initializeData value to a location and filename where the trace information will be saved. If you use the “.svclog” extension you can load the file directly in the MICROSOFT Service Trace Viewer.
When you start the POS application you should then see your file (with a _00 appended) in your directory:
One additional note on the new POS logging: the file will re-created every time you launch the POS application. If you need to save traces from previous runs you will need to intercept the file and copy it to a new location before restarting POS.exe.
Additional Note: The RollingXmlWriterTraceListener is unique to Dynamics AX for Retail and has been written to manage the size of log files to avoid filling the hard drive space. The re-creation of the file on each launch of the POS is one of the ways that this is done.
However, you are free to implement any .Net Trace Listeners if you wish to log in other ways. Here is an example of logging to a simple text file. Note that this would be unmanaged so could fill your drive if left as is:
<system.diagnostics>
<trace autoflush=”true” />
<sources>
<source name=”Microsoft.Dynamics.Retail.Tracing.RetailAxTrace” switchValue=”Information”>
<listeners>
<add name=”TextFile” type=”System.Diagnostics.TextWriterTraceListener” initializeData=”d:\temp\retailText.txt” traceOutputOptions=”ProcessId, DateTime” />
</listeners>
</source>
</sources>
< /system.diagnostics>
One other trick to quickly gather traces is to use the Sysinternals DebugView tool which will act as a “catch-all” debug capture. Make sure that this line is not in your config file, though, as it relies on the Default listener:
<listeners>
<remove name=”Default” />
</listeners>
Commerce Data Exchange: Synch Service
With the exception of the name change, logging for the Synch Service (previously Retail Store Connect) hasn’t changed much since previous versions (so this section will be familiar to many).
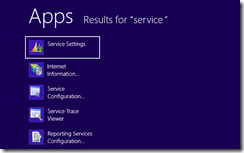
Launch the Commerce Data Exchange Synch Service Settings application and select a service instance. Note: if you’re looking for this in your start menu, the icon is actually named “Service Settings” which makes it a bit hard to find.
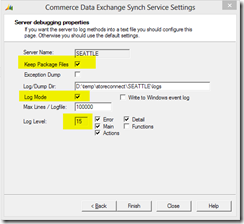
Press “next” four times to get to the Server Debugging Properties form. Here you can set the Log Level by marking one or more of the checkboxes (Error, Main, Actions, Detail, Functions). We will usually have you set the level to 15 (all except Functions) sing logging at the Functions level will flood the log file and isn’t very helpful.
Notes:
- Make sure you mark the Log Mode checkbox. This is the “master switch” for logging – if you do not have this marked, you will not get any logging at all.
- You can write log messages to the Windows Event Log, but this is not a very efficient way to view the messages, so don’t bother with this.
- By default, the log files are stored to the %s\Microsoft Dynamics AX\50\Retail Store Connect\[INSTANCE]\logs folder. %s is not a Windows standard – in Retail Store Connect it resolves to the service user’s Appdata folder. Since I have my service running as my own domain account, this is where that directory would be: C:\Users\serstad\AppData\Local\Microsoft Dynamics AX\50\Retail Store Connect\ST9CONNECT\logs
- The log files are automatically recycled based on the number you enter in the “Max Lines / Logile” field. There are six files: 1.log, 2.log, 3.log, 1.old, 2.old, and 3.old. All six files are relevant and it is pretty random to determine which one is the “current” file.
- It can sometimes be useful to see the contents of the package files that are being sent through Retail Store Connect. By marking the “Keep Package Files” checkbox, those XML files will be stored in the “work” directory as defined in the “Working Directory” field (two screens previous). It is recommended to only do this for a limited period of time, as they can fill up a hard drive if left on permanently.
Monitoring your overall Synch Service ecosystem is also very important. There are a couple of tools to help with this:
-
- The Messaging database for Synch Service usually gives a quick glance at the health of a particular instance. Here are two queries that I like to use:
select Servermsg, Status, * from outgoingmessages order by packageno desc
select RemotePkg, Servermsg, * from incomingmessages order by packageno desc
- In Retail Headquarters you can set up Synch Service instances to “call home” with status of each message that gets sent. You can use the Commerce Data Exchange: Synch Service Messages inquiry to get a view of all the jobs you have run and see which ones have had errors.
Headquarters
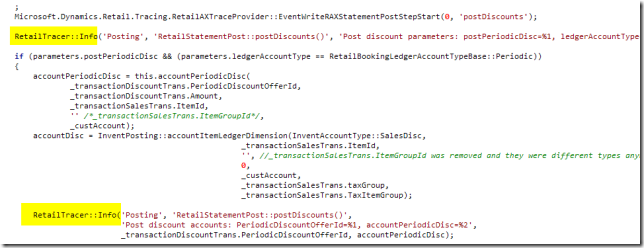
Tracing has also been added to Headquarters in AX itself for Retail 2012 R1 and R2. This can be very useful in tracking down problems with statement calculation, statement post, running scheduler jobs, and debugging logic in calls to the Real-time Service (Transaction Service). If you look in the X++ code for any Retail process you will see these lines scattered through-out:
There are two ways to view this trace information:
Modify the AX32.exe.config file (CU1 only)
The RetailTracer in Headquarters can log messages to an XML file using the same methods as the Real-time Service and POS. To turn on this tracing, you need to modify the AX32.exe.config file for an AX client. By default this is located here: C:\Program Files (x86)\Microsoft Dynamics AX\60\Client\Bin\Ax32.exe.config
By default this file does not have a System.Diagnostics section so you will have to create one using the example below:
<system.diagnostics>
<trace autoflush=”true” />
<sources>
<source name=”Microsoft.Dynamics.Retail.Tracing.RetailAxTrace” switchValue=”All”>
<listeners>
<add name=”RollingXmlWriterTraceListener” type=”Microsoft.Dynamics.Retail.Diagnostics.RollingXmlWriterTraceListener, Microsoft.Dynamics.Retail.Diagnostics”
initializeData=”d:\temp\retaillogs\HQ.svclog”
MaxLogFileInBytes=”50000000″
traceOutputOptions=”ProcessId, DateTime, LogicalOperationStack” />
</listeners>
</source>
</sources>
< /system.diagnostics>
Note how the switchValue and initializeData values are similar to Real-time Service and POS.
If you would rather log directly to a text file that is very easy to do as well:
<system.diagnostics>
<trace autoflush=”true” />
<sources>
<source name=”Microsoft.Dynamics.Retail.Tracing.RetailAxTrace” switchValue=”Information”>
<listeners>
<add name=”TextFile” type=”System.Diagnostics.TextWriterTraceListener” initializeData=”d:\temp\retaillogs\HQ.txt” traceOutputOptions=”ProcessId, DateTime” />
</listeners>
</source>
</sources>
< /system.diagnostics>
Note that you need to install 2012 R2 CU1 for this logging functionality to work properly. Also, you won’t get messages from X++ code consumed by the Real-time Service since that logic is running on the AOS via the Business Connector. In order to log those messages you will need to set up ETW tracing on you AOS as described below.
Windows Event Tracing (ETW) for AX
The RetailTracer will also log messages to the Windows Event Tracing (ETW) that was introduced in AX 2012 R1.
Online Store (SharePoint)
One of the biggest pieces of AX for Retail 2012 R2) is the new Online Store functionality. Logging for this component is done in the standard SharePoint ULS (Unified Logging Service) and can be configured in SharePoint itself.
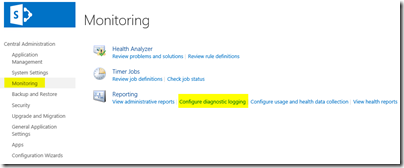
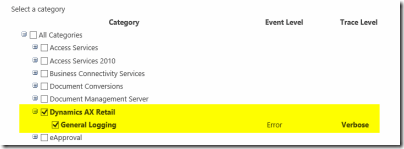
To turn on logging, go to SharePoint Central Administration > Monitoring > Configure Diagnostics Logging:
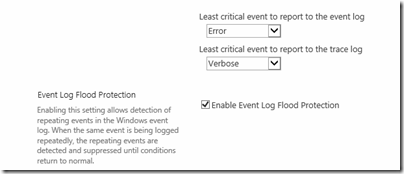
Find and expand the Dynamics AX Retail category in the list and then select what level of event tracing you want to send to either the Event Log or the Trace Log by using the dropdowns further down:
Finally, hit “OK” way in the lower-right hand corner to save your changes. This will now start logging any AX for Retail code running on the server: the storefront itself, service plug-ins, SharePoint scheduled jobs (such as the important RetailPublishingJob). By default these log files can be found here: %CommonProgramFiles%\Microsoft Shared\Web Server Extensions\15\LOGS\
The resulting files can be read in any text editor or the handful of SharePoint ULS Viewers that are in the community. There are also some SharePoint Powershell Cmdlets that you can use to extract information from the logs.
Logging and tracing is the primary tool that we use in Support to assist customers and partners with their deployments. We are always giving suggestions to the product team on areas that could use more tracing; feel free to leave a comment below if there are areas you feel could use better logging.

