Using SQL Server Extended Events to produce a Blocked Process Report
Blocking in SQL Server is a mixed blessing! It is a SQL Server’s way of ensuring data integrity which is a basic requirement for any database management system but when users encounter a lot of blocking it makes the application appear slow and sometimes unusable. Therefore, system administrators need to be able to analyse SQL Server blocking and take action to minimise it in order to get the best database performance possible.
A traditional approach to blocking analysis is to use Windows Performance Monitor. The “SQL Server:Locks” counters gives you a graphical view of lock activity, e.g:
- How many locks are being requested per second
- How long SQL queries are waiting due to blocking.
- How many locks requests are timing out.
You can then use SQL Server Agent to configure alerts on these performance counters and be notified, for example, when lock wait times exceed whatever threshold you deem acceptable.
Troubleshooting blocking using Performance Monitor (or SQL Server Profiler) is all very well but can impose a performance hit which may not be practical for a busy, resource intensive live environment. Also, it may not provide all of the details you need to understand the cause of the blocking. If only there was a lightweight way of monitoring SQL Server blocking problems which would be suitable for a busy live environment!
You might be surprised to find out that just such a lightweight monitoring mechanism has existed since SQL Server 2008 was released. Ladies and gentlemen, allow me to introduce my good friend, the “Extended Events” feature of SQL Server! Several key performance indicators can be monitored using SQL Server Extended Events. The following steps show in detail how you can create a “Blocked Process Report” for your SQL Server environment to capture relevant blocking details without incurring much of a performance penalty.
First, you need to decide how many seconds a process should be blocked for in order for it to be included in the report, i.e. the blocked process threshold. If you set this value too low you may generate too much noise in the report. If you set it too high you might not get any processes waiting long enough to appear in the report. For Microsoft Dynamics NAV environments, the value should be less than any “Lock Timeout” setting which may be enabled (as set in the NAV Development Environment, see File -> Database -> “Alter Database” -> “Advanced” tab). For this exercise I will only include processes which are blocked for more than 5 seconds in my Blocked Process Report.
So, I need to run some TSQL statements in order to configure 5 seconds as the blocked process threshold. The following will do the trick:
exec sp_configure ‘show advanced options’,1;
go
reconfigure
go
exec sp_configure ‘blocked process threshold’,5;
go
reconfigure
go
NB: After running the above, you may want to consider setting the ‘show advanced options’ value back to ‘0’ if your SQL Server administrator prefers this.
Now, to create and test the Blocked Process Report. The following are the steps required (examples are based on SQL Server 2012 SP1):
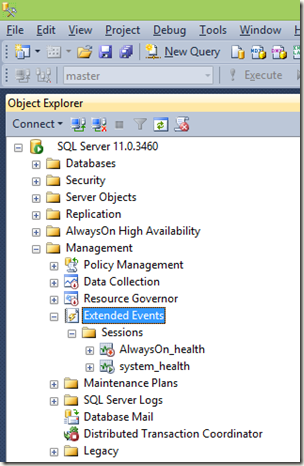
1. Start SQL Server Management Studio (SSMS) and open the “Extended Events” folder as shown below:
2. Right click on the “Sessions” folder and select “New Session Wizard”. Click “Next” on the Introduction page.
3. When prompted, provide a “Session Name”, e.g. My Blocked Process report.
4. For the “Choose Template” page select “Do not use template”
5. In the “Select Events To Capture” enter the word “blocked” in the “Event Library” text box. This will limit the events listed so you can easily identify the “blocked_process_report”. Select this report and then click on the ‘>’ button in order to move this into the “Selected events” pane. Then click “Next”.
6. In the “Capture Global Fields” page, click on the “Finish” button.
7. On the “Success” page, click on the “Close” button.
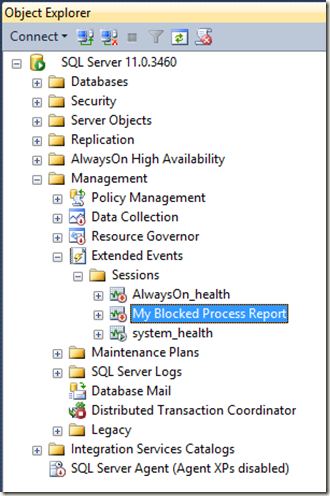
8. At this stage you have created a Blocked Process Report and should be able to see it shown as an “Extended Report” Session, like this:
9. For our requirements, we want to store the report session data into a file as this will be more convenient to work with, especially if you want to send it to a Microsoft Support Engineer! To do this, right click on the “My Blocked Process Report” and select “Properties”.
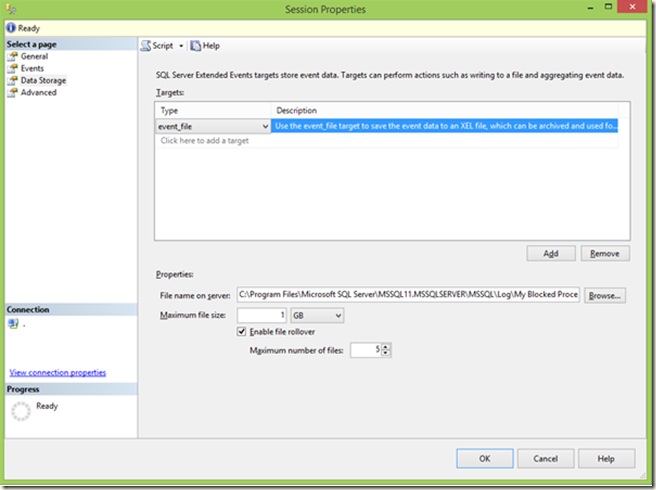
10. In the left pane of the “Session Properties” widow select the “Data Storage” page (see screenshot in the step below:
11. Click on the “Add” button to add a new storage type. In the “Type” column select “event_file” as shown here:
12. Now fill out the “Properties” to specify a where you want the report file to be placed and what space values you want to allow. Then click “OK”
Of course, there are many other options you can configure and additional information you can capture but for this exercise we will just create a simple report in order to try out the feature. You can right-click on the “My Blocked Process” report and change other properties later if you like.
So, let’s start our report session and then cause some blocking so you can see how the report looks. The following steps can achieve this:
1. To start the session simply right click on “My Blocked Process Report” and select “Start Session”.
2. To create some blocking, first run the following TSQL commands in a SSMS Query window:
use tempdb
go
create table Table1 (a1 int)
go
begin tran
insert into Table1 values(1)
go
3. Now start a 2nd TSQL Query Window and run the following command which will be blocked behind the connection running the above statements:
use tempdb
go
select * from table1
4. Leave the 2nd TSQL Query Windows running in a blocked state for a few moments so that the blocking report can start to accumulate blocking events. After about a minute, enter the following TSQL statement in the 1st SSMS Query Window to remove the cause of this blocking incident:
rollback tran
5. Now right-click on the “My Blocked Process Report” in SSMS and select “Stop Session”.
6. To review the details in the blocked process report go to the file location you specified for the “event-file” you stipulated earlier (see step 11 above). In the folder you specified you should see a file with a name like this:
“My Blocked Process Report_0_130651143384850000.xel”
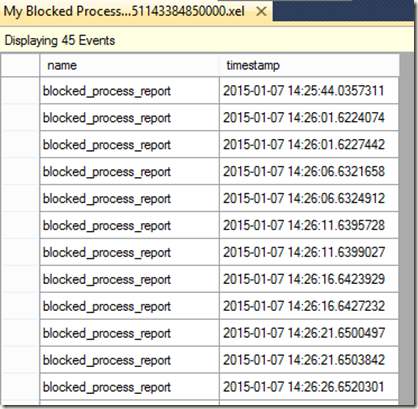
7. Double click on this report and it will open it in SSMS. It should contains some events related to the blocking we created above and will look like this:
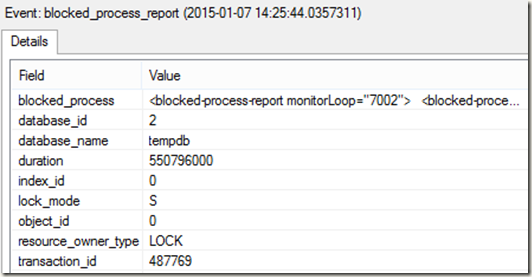
8. As you can see, there are multiple events recorded. This is because we had a single blocked process which was waiting for over 5 seconds (but it was blocked for a minute so it was reported multiple times). Double-click on the first of these events and you will see some more detail about the blocking incident, like this:
9. At first glance, the fields shown above may appear only mildly interesting. The duration value is in microseconds so the above event records a blocking process which had been in a blocked state for just over 5 seconds. You can see that the block occurred in the tempdb database along with some other details. You could be forgiven for being underwhelmed by the information displayed here but before giving up take a closer look at the “blocked_process” field which contains some xml content. This is the good stuff we are looking for. Double-click on the xml value in this field to open it up in SSMS. You will see something like the following:
10. This information can be extremely useful for understanding the blocking problem. Notice that it contains the following details (and more):
For the Blocked Process:
- Object ID
- Wait time (in milliseconds this time)
- When the transaction started
- Lock Mode
- Transaction status (e.g. suspended)
- Connection ID (SPID)
- Client application name
- Machine name (Hostname)
- Login name
- Isolation level
- Input buffer, i.e. the actual SQL statement which was blocked.
For the Blocking process:
- Object ID
- Wait time
- Connection ID
- Input buffer, i.e. the SQL statement which caused the blocking. Please note that this only appears on the first event record for each distinct blocking incident.
Hopefully you will find this approach to diagnosing blocking problems helpful. As you may have noticed, Extended Event Sessions can be used to collect all sorts of other system information from SQL Server but in this blog we have only been concerned with blocking analysis. The fact that these Extended Event Sessions are fully integrated with the SQL Server engine means that they have very little impact on performance making this approach ideal for monitoring live environments.
