
Use Windows Performance monitor alerts to start an Dynamics AX ETL trace (Trace parser)
Description:
In this article, I describe how you can activate and catch an AX trace based on an
alert raised.
There are situations where you need to collect a trace for a short period example
during high CPU usage. The moment is hard to catch if it is not 100% predictable.
In these cases, you can use the standard Windows Perfmon alert trace, where you
add the counters you want to trace and when the threshold exceeds, another
process is activated.
How to set it up:
AXTRACE
- Go to Start/Run/Perfmon
- Go to Data Collector Sets
- Right Click on User defined and new/Data collector sets
- Type AXTRACE in the Textbox and mark Create Manually (Advanced) / Press Next
- Mark Event Trace data and press Next
- Press Add and find Microsoft Dynamics-AX tracing / Press OK
- Press Editon Keywords Any
- Mark all trace event /Press OK
- Press Finish
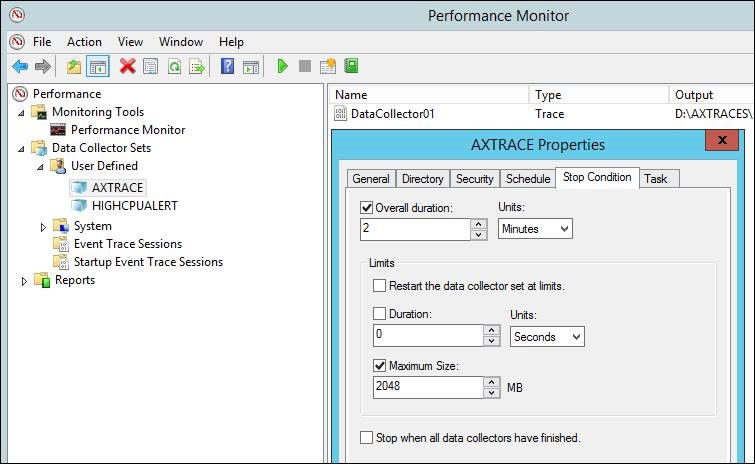
- Now Edit the AXTRACE and in Stop Condition set example the Overall Duration to 2 minutes
- If the duration is longer or the system is very busy, Consider Maximum Size, so the file size
is not exceeding example 10 GB.
HIGHCPUALERT
- Go to Start/Run/Perfmon
- Go to Data Collector Sets
- Right Click on User defined and new/Data collector sets
- Type HIGHCPUALERT in the Textbox and mark Create Manually (Advanced) / Press Next
- Mark Performance Counter Alert /Press Next
- Press Add
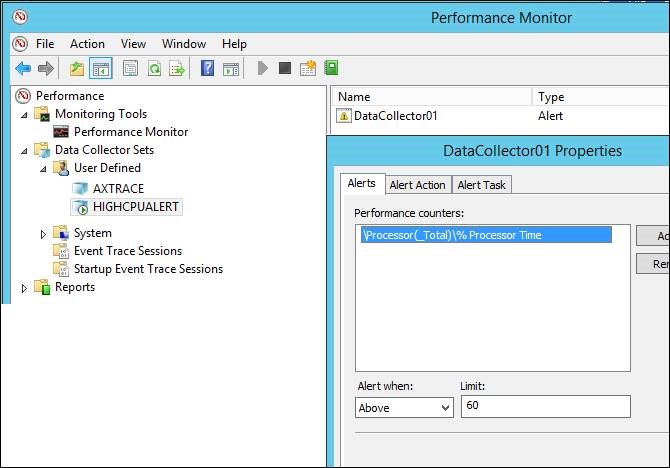
- Find Processor/%Processor Time and press Add and OK
- Alert Above example 60/press Next and Finish
- Edit the Datacollector01 for the HIGHCPUALERT and go to Alert Action
- Lookup and choose the AXTRACE collector sets/Press OK
- Right click and start the HIGHCPUALERT
AXTRACE
HIGHCPUALERT
The above is only an example. Many different counters can be used and different actions can be executed when an alert is raised.
Author:
Kim Truelsen, Microsoft
Date 10/11-2015