- Home
- Security, Compliance, and Identity
- Security, Compliance, and Identity Blog
- What’s New in 2012 R2: Service Provider & Tenant IaaS Experience
- Subscribe to RSS Feed
- Mark as New
- Mark as Read
- Bookmark
- Subscribe
- Printer Friendly Page
- Report Inappropriate Content

Part 5 of a 9-part
series
. Today’s post is the 2nd of two sections; to read the first half, click
here
.
I recently had an opportunity to speak with a number of leaders from the former VMWare User Group (VMUG), and it was an incredibly educational experience. I say “former” because many of the VMUG user group chapters are updating their focus/charter and are renaming themselves the Virtual Technology User Group ( VTUG ). This change is a direct result of how they see market share and industry momentum moving to solutions like the consistent clouds developed by Microsoft.
In a recent follow up conversation with these leaders, I asked them to describe some common topics they hear discussed in their meetings. One of the leaders commented that the community is saying something really specific: “If you want to have job security and a high paying job for the next 10 years, you better be on your way to becoming an expert in the Microsoft clouds . That is where this industry is going.”
When I look at what is delivered in these R2 releases, the innovation is just staggering. This industry-leading innovation – the types of technical advances that VTUG groups are confidently betting on – is really exciting.
With this innovation in mind, in today’s post I want to discuss some of the work we are doing around the user experience for the teams creating the services that are offered, and I want to examine the experience that can be offered to the consumer of the cloud ( i.e. the tenants). While we were developing R2, we spent a lot of time ensuring that we truly understood exactly who would be using our solutions. We exhaustively researched their needs, their motivations, and how various IT users and IT teams relate to each other. This process was incredibly important because these individuals and teams all have very different needs – and we were committed to supporting all of them.
The R2 wave of products have been built with this understanding. The IT teams actually building and operating a cloud(s) have very different needs than individuals who are consuming the cloud (tenants). The experience for the infrastructure teams will focus on just that – the infrastructure; the experience for the tenants will focus on the applications/ services and their seamless operation and maintenance.
In yesterday’s post we focused heavily on the innovations in these R2 releases in the infrastructure – storage, network, and compute – and, in this post, Erin Chapple , a Partner Group Program Manager in the Windows Server & System Center team, will provide an in-depth look at Service Provider and Tenant experience and innovations with Windows Server 2012 R2, System Center 2012 R2, and the new features in Windows Azure Pack.
As always in this series , check out the “ Next Steps ” at the bottom of this post for links to a variety of engineering content with hyper-technical overviews of the concepts examined in this post. Also , if you haven’t started your own evaluation of the 2012 R2 previews, visit the TechNet Evaluation Center and take a test drive today!
* * *
Delightful Experiences
We focus on delivering the best infrastructure possible in order to provide delightful experiences to our customers. The two work hand-in-hand: The right infrastructure enables key customer-facing scenarios, and the focus on the experience ensures that customers can get the most out of their infrastructure investments.
In this release, we focused on two core personas: the Service Provider who is responsible for deploying and operating the IaaS, and the tenant (or consumer) who consumes those services provided by the Service Provider.
Service Provider Experience
With Windows Server 2012, System Center 2012 SP1, and Windows Azure Pack v1, we established the foundation for IaaS: A self-service portal on top of resource pools. To determine which enhancements were necessary for the R2 wave, we spent time with customers (ranging from enterprises to Service Providers, to groups within Microsoft responsible for IaaS-type services) to better understand what they needed in order to deliver an end-to-end IaaS experience. Three main pieces of feedback emerged:
-
A self-service experience is critical to deliver rich end-to-end IaaS.
A rich self-service experience is not only for tenant customers – it is equally important for Service administrators. With the previous release, our self-service experience allowed Service administrators to create and manage Plans, and tenant administrators could manage their subscriptions to those Plans. In the 2012 R2 release, we include new capabilities to provide a much richer experience. One new feature, is called Plan add-ons , allows the administrator to upsell value-added services to subscribers’ existing plans. Another feature is the Virtual Machine Role , which allows the administrators to create Virtual Machine templates (a tier of VMs that behave as a singleton). These templates can be deployed in a consistent manner across private, hosted, and Windows Azure public clouds. Another feature enables providers to offer their enterprise tenants the ability to extend and stretch their network to the provider-hosted clouds. These features and others combine to deliver rich IaaS capabilities in the R2 release. -
Metering tenant resource usage is essential in a cloud business model.
The cloud business model requires providers to track tenant resource utilization and be able to bill or charge only for what was used by the tenant. Furthermore, the primary attraction of the cloud is its elasticity – tracking usage consumption in an elastic environment requires the providers to process large volumes of data and pivot on the correct values, to be able to successfully monetize their services. In our conversations with customers and providers, they clearly expressed the need for rich metering capability along with analytics covering that metered usage. In the 2012 R2 release, we provide two distinct capabilities in response to this feedback. To begin with, there is a REST Usage API, which provides resource utilization data at 15 minute granularity fidelity for each subscription. Providers use this API to extract utilization data and integrate the data feed with their own billing system in order to create the billing reports that are relevant for their business needs. In addition to the Usage API, we also provide Usage Reports in Excel that provide analytics and trending information. This is very useful for capacity planning based on resource consumption trends, and it allows the Service Provider to perform capacity forecasting – which is yet another core customer-driven innovation. -
Reduce COGS by using automation and by leveraging existing investments.
COGS cannot be minimized by reducing CapEx costs alone. It is just as important to enable Service Administrators to maximize utilization of their existing processes and systems along with other resources (in other words, make what they have work even better), and reduce the need to have fragmented provisioning and operating process across their data centers. As we looked into how our Service Administrator customers can continue to reduce COGS and streamline their operations, the need to continue our investments in automation and integration scenarios became abundantly clear. In today’s data centers, Windows PowerShell is the framework for IT coordination of infrastructure task management. To address this directly, in 2012 R2 we have extended automation capabilities by enabling the construction of complex automation workflows, and we have ensured that all the activities inside the data center can be expressed using PowerShell constructs.
These learnings helped crystallize our core customer vision for the Service Provider in the 2012 R2 release:
Enable Service Providers with a rich IaaS platform that seamlessly integrates with existing systems and processes within the datacenter and has rich self-service experiences while having the lowest COGS.
This vision defined the key scenario areas we targeted:
- Managing provider offers and tenant subscriptions
- Customizing self-service experience for tenants
- Automation for creating efficient, policy driven and consistent process for Service Providers
- Tenant resource usage, billing and analytics
Scenario 1: Managing Provider Offers and Tenant Subscriptions
Success for a Service Provider business largely hinges on the ability to attract and retain tenants. It therefore falls to the Service Provider to think about how to use service offerings to attract tenants; to consider different tactics for differentiation, as well as ongoing efforts like upselling and retention to maintain healthy tenant accounts. To help Service Providers meet these challenges, we have invested in key enhancements to the service management experience targeting these specific areas:
- Use value-based offers to attract tenants and drive new subscriptions.
- Offer differentiation and upsell to drive more consumption.
- Manage tenant accounts and subscriptions.
Service Providers can build bundles of many different service offers, which are often called “ Plans .” Plans include various services that can be assembled together in order to create subscriber-specific value offerings. Tenants then consume an offer by subscribing to a plan. In a very general sense, a cloud is nothing more to the consumer (in this case, the tenant ) than a set of capabilities ( services ) at some capacity ( quotas ). When a service provider creates offers, they need to know what types of workloads customers want (which services to include) and how they will be consumed – as well as some basic intuition about the consumption habits of their tenants (how much will they need, and how fast will that change, etc.).
We designed an easy-to-use experience for creating offers, selecting the kinds of services or capabilities to include, and setting the quotas to control how much can be consumed by any single subscription. But, obviously, it goes beyond a simple set of compute, storage, and networking capabilities at some quota amount. One of the most important aspects of offer construction is the process of including library content to facilitate simplified application development. For that reason, the offer construction experience also features a way to include templates for foundational VM configurations and workloads.
Use differentiation to induce more (high-value) usageArmed with the ability to attract tenants to the service through precise service offerings, the Service Provider now needs a way to focus on the quality of the tenant experience. This can be either for the purpose of driving margin growth (in the case of pubic hosting), or customer satisfaction initiatives (public or private), or both. To achieve this, we introduced the concept of an add-on that gives the service provider a more precise mechanism for exposing offers. Plan add-ons are usually targeted at specific plans or tenants, and they are used to drive up-sell opportunities. For example, Service Providers can create a plan add-on called “Peak Threshold Quota Expansion” that can be targeted towards subscribers who show seasonality in their consumption patterns.
Manage accounts & subscriptionsLastly, Service Providers need a way to manage the accounts and subscriptions of their tenants. The motivations for direct management of accounts and subscriptions can vary from white-glove service, to loyalty programs, and rewards to account health/delinquency, and the need to maintain health of the shared environment for all tenants.
The features for Service Providers are high-level, but provide comprehensive capabilities to cover a variety of scenarios, including:
- Accounts : Create, suspend, delete, reset password.
- Subscriptions : Create, add/remove co-administrators, suspend, migrate, delete.
- Add-ons : Create, associate/remove, delete.
Scenario 2: Customizing Self-Service Experience for Tenants
One of the design goals of the R2 release is to provide a consistent experience for tenants across private, hosted and Windows Azure public clouds. As part of the new Web Sites and Virtual Machines service offerings in Windows Azure, we launched a modern, web standards-based, device-friendly web portal for our Windows Azure customers. The Windows Azure portal has received rave reviews and has dramatically eased the manageability of the cloud services. We heard from our customers that they would like the similar capabilities in the Windows Azure Pack portal, which allows them to change the various visual elements such as colors, fonts, images, and logos. They also wanted the portal to enable them to add new services that would help them differentiate, while staying consistent with the overall experience.
In the R2 release, the same great experience in Windows Azure is now available on Windows Server for our customers through Windows Azure Pack. This Self-Service Tenant Portal has been designed with the following capabilities.
- Customizable Service Provider portal experience
- Customer-approved branding and theming experiences
- Ability to add new services
- Ability to differentiate
While these capabilities offer a great in-the-box experience that is consistent with Windows Azure, all these capabilities are also available through an API for customers who want to build their own self-service portal. To facilitate your efforts to build and develop your own self-service portal, in September we will share the Windows Azure Pack Tenant self-service portal source code that can be leveraged as a sample. Upcoming blog posts will go into greater detail on this experience.
Customize the experience to fit the branding and theming needs of the portalCustomers would like the tenant-facing portal to reflect the brand that their business represents. Therefore, it is very essential that the portal offers the customers the ability to customize the look and feel of the portal to reflect their choice of colors, fonts, logos, and various other artifacts that represent the brand. To enable this scenario, the Windows Azure Pack Self-Service Tenant Portal has been designed from the ground up with cloud services in mind, and has been updated to allow our partners and customers to adapt it to their business needs.
Customizable Web ExperienceThe Self-Service Tenant Portal enables easy customization with your theme and brand, a custom login experience, and banners. The sample kit contains CSS files to easily override the default images, logos, colors, and the like.
Add-on servicesAs new services are introduced, the portal can light up these services easily. This capability is possible because the framework uses REST APIs and scales to a large number of services easily.
For example, the ability to provide custom domains is a very common need for service providers. The self-service framework allows the service provider to include these value-added services to the framework easily and in a format that makes them ready for their tenants to consume.
In the example seen in Figure 5 (see below), “Web Site Domains” is a new Resource Provider, providing custom domains. When configured, the portal lights up with this capability, allowing the tenants to subscribe to the offer.

Figure 5: Add-on services.
The ability to differentiate the tenant experience is a key strategy for many service providers, and to support such scenarios the Tenant Portal source code is provided as mentioned earlier. This enables the service provider to use the Tenant Portal as a sample and to use the Service Management API’s to integrate the experience with their own portal.
Scenario 3: Automation for Creating Efficient, Policy Driven and Consistent Process for Service Providers
Running a data center is a complex operation in which many different systems and processes need to be aligned to achieve efficiencies at cloud scale. Automating key workflows, therefore, becomes an essential part of the data center operations. Automation capabilities have been part of our cloud solutions for a long time – System Center Orchestrator has enabled data center administrators to encapsulate complex tasks using runbooks for years, and it helps data center admins reap the benefits of automation with ease. With the 2012 release of System Center, there is now tighter integration between Service Manager and Orchestrator which enables the self-service scenarios powered by automation.
Our goals with automation have always been to enable our customers to drive value within their organization by:
- Integrating, extending, and optimizing existing investments
- Lowering costs and improving predictability
- Delivering flexible and reliable services
Another key area of investment within 2012 R2 is Service Management Automation , which integrates into the Windows Azure Portal and enables operations exposed through the self-service portal (and via the Service Management API) to be automated using PowerShell modules.
Integrate, extend, and optimize investmentsService Management Automation (SMA) taps into the power and popularity of Windows PowerShell. Specifically, Windows PowerShell encapsulates automation tasks while SMA builds workflows on top of it and provides a user interface for managing the workflows in the portal. This allows the co-ordination of IT-based activities (represented as PowerShell cmdlets), and it allows you to create IT processes (called runbooks) through the assembly of various PowerShell cmdlets.
In Figure 6 (see below), you can see that the Automation Service is represented in the WAP as a core resource termed “Automation.” This diagram also depicts a variety of potential integration end-points that can participate in IT-coordinated workflows as shown in the figure below.

Figure 6: Overview of Service Management Automation.
Automating tasks that are manual, error prone, and often repeated lowers costs and enables providers to focus on work that adds business value. Windows PowerShell encapsulates automation tasks and SMA builds workflows on top of it, thus providing a user interface for managing the workflows in the portal. By building on top of the Windows PowerShell framework, we are enabling Service Providers to leverage their existing investments in Windows PowerShell cmdlets, and we are also making it easy for them to continue to reap the benefits of automation.
Deliver flexible and reliable servicesService reliability can be vastly improved by ensuring that most error prone, manual, and complex processes are encapsulated in a workflow that is easy to author, operate and administer. Orchestrating these workflows across multiple tools and systems improves service reliability.
When we talked to service providers and enterprises, it was clear that providers have complex processes and multiple systems within their IT infrastructure. Service providers have often invested a lot in user onboarding, provisioning, de-provisioning, and subscriber management processes – and they have many different systems that need to be aligned during each of these processes.
In R2, we targeted investments to enable these scenarios. For example, Windows Azure Pack’s event generation framework generates events of various types, including VM start/stop, plan subscription, and new user creation. These events can be integrated with workflows using the SMA user interface in the Windows Azure Pack portal. Now you get the benefit of automation with process integration – and with it come repeatability and predictability . These events can then be integrated with workflows using the SMA user interface in the Windows Azure Pack portal.
In summary, SMA is about reducing costs by encapsulating complex, error prone, manual and repetitive tasks into runbooks which can be used in automation and, where/when appropriate, use the same patterns to integrate with other systems that need to participate in complex processes within the data center.
Scenario 4: Tenant Resource Usage, Billing, and Analytics
The cloud operating model requires providers to track tenant resource utilization and be able to bill or charge only for what was used by the tenant.
In the 2012 R2 release, we made targeted investments in this area. To begin with, there is a REST Usage API, which provides resource utilization data (at hourly fidelity) for each subscription. Providers use this API to extract utilization data and integrate the data feed with their own billing system to create the billing reports. In addition to the Usage API, we also provide Usage Reports in Excel that provide analytics and trending information. This is very useful for capacity planning based on resource consumption trends.
Using the REST Usage API to Enable Billing and Chargeback ScenariosThe intention and design of the Usage Metering system in R2 is to collect and aggregate all the usage data across all the resource providers and expose the usage data via the REST Usage API. The Usage API is the only way to extract the data from the Usage Metering System . Most Service Providers have a billing system that they use today and this is used to generate monthly bills to subscribers. Using this API, Service Providers can easily integrate the Tenant Resource Utilization with their existing billing system. The blog post “How to integrate your Billing System with the Usage Metering System ” goes into detail regarding how to leverage the API and the samples to create a billing adaptor. Doing this helps integrate the billing system with the Usage Metering system.
Usage reports and out-of-the box analytics for IaaS usageIt is very important for Service Providers to understand how their tenants consume the offers they provide. In R2, we provide out-of-the box data warehousing capabilities that correlate subscriptions with usage across VMs as well as analytical reports. Excel is the most widely used tool when it comes to reporting, thus, with this popularity in mind, we designed the Usage reports to be Excel friendly.
In Figure 7 (see below), the usage report shows VM Usage data in hourly granularity for all subscribers. The filter allows you to scope the data to selected subscribers for the selected date ranges.

Figure 7: Usage Report.
Though Excel reports are very powerful, Service Providers also asked for a dashboard showing all the key usage metrics in order to give a “glance-able” indication of overall heath. The dashboard capabilities of SharePoint are very useful when a lot of people within an organization need to view the key performance indicators for a business. For a Service Provider, the top-line revenue can be measured by of how many of these services are used by their tenants, and then understanding which of the subscribers drive their business. For such scenarios, Usage dashboards are very critical and provide a convenient way to both consume and perform drill through analytics if desired.
In Figure 8 (see below), VM runtime statistics are displayed in four key dimensions:
- The first chart (on the left) shows VM Runtime statistics for each quarter. Very quickly, one can understand how the current quarter is shaping up when compared to the previous one.
- Similarly the second chart shows the VM Runtime on a monthly basis.
- The third chart displays which Cloud/Plan is the most popular among the customers.
- The forth chart shows which subscriber is generating the most usage in the system.

Figure 8: Usage dashboard experience.
As you can see, the key metrics for the business are available at a glance. If further details are needed, a simple drill-through experience allows the user to select a particular chart and hone in on the details that compose the chart. This all leads to a powerful self-service analytics experience.
Server Inventory ReportService Providers need to stay compliant within the Service Provider Licensing Agreement (SPLA) , and, in a quickly changing data center, keeping track of server and host inventory for licensing needs can be very difficult. This feedback was commonly shared by Service Providers, and we have made a series of key investments to make this entire process easier for them to execute.
In R2 we introduce the Server Inventory report as a feature of Service Reporting component, which tracks all the servers and the VMs. The SPLA requires the service providers to compute the license costs for Microsoft software at the end of the month. The formula for calculating these licensing costs includes the edition of Windows Server OS, the processor count, and the maximum number of Windows Virtual Machines that were hosted on the severs for that month.
To assist in this scenario, we provide an out-of-the-box Server Inventory report that processes all the calculations and displays the information for easy consumption. Figure 9 below shows a report where the processor count and the VM Instance count are displayed for the selected months.

Figure 9: Sample Server Inventory Report.
One of the most common concerns of Service Providers is the need to be able to look back at this history and accurately compare key performance indicators (KPI) across various time dimensions to better understand growth patterns. To support such a scenario, we have developed the licensing report on top of a data warehousing module. Based on the report below, for example, it is very clear to see that the computing and resource capacity used by the consumer grew over that last monthly cycle. The reporting system keeps a cumulative count of resources, and uses this information in determining compliance with licensing.
Requirements like these also exist in licensing scenarios. To support such a scenario, we have developed the licensing report on top of the data warehousing module. As noted in Figure 9, it is possible to observe the growth of processors and VM instances.
The ability to surface data aggregated over time becomes a very powerful auditing tool as well. In R2, the default storage is for three years; this allows the provider to go back in history and understand the SPLA compliance status for the Windows Servers managed by the R2 stack.
Tenant Administrator Experience
As mentioned above, a key design goal of the 2012 R2 wave was to provide a consistent experience for tenants across private, hosted and Windows Azure public clouds. We achieved this by delivering a consistent framework and tool set for running modern cloud services. tenants can now run and operate a rich set of cloud services in partner-provided data centers just as easily as they can by using Windows Azure. In short, the core vision for the tenant administrator experience in the R2 release is to:
Provide a rich self-service experience that enables tenants to self-provision and scale applications in an Azure-consistent manner
This vision defined our target scenarios:
- Self-Service Tenant Portal
- Modern Website Services
- Self-Provisioning Scalable Tenant Capacity
- Troubleshooting Virtual Machines
Scenario 1: Self-Service Tenant Portal
Windows Azure Pack includes a Self-Service Tenant Portal and a set of REST management APIs. The portal is deployed and operated by the Service Provider. Tenants use it to manage the services and infrastructure that are operated by the Service Provider. The Self-Service Tenant Portal is a companion portal to the Provider portal and can only be deployed and used if the operator has configured their environment with the Provider portal or used the Provider REST APIs.
Figure 10(see below) illustrates the high-level technologies of Windows Azure Pack, and it compares the layering of these technologies in Windows Azure with Windows Azure Pack running on Windows Server 2012 R2.

Figure 10: Comparison of Windows Azure Pack technologies running in Windows Azure and Windows Server.
Because the Self-Service Tenant Portal is based on the same framework used by Windows Azure,
the same rich dev-op experience
originally developed for Windows Azure Websites (described in the next scenario) is available in partner data centers using Windows Server and System Center 2012 R2.
Scenario 2: Modern Website Services
One of the new Platform-as-a-Service (PaaS) services available in Windows Azure is Windows Azure Websites . Rather than a traditional IIS web hosting, this is instead a true elastic cloud service for provisioning and scaling website applications. It offers a rich dev-ops management experience for running and scaling the website, as well as deep integration with popular open source code-control solutions such as GIT.
As part of our effort to create a consistent experience across clouds, we invested to bring this modern website PaaS service from Windows Azure and run it natively on Windows Server . The end result is a set of REST APIs for consumers along with a management experience which is consistent with Windows Azure.

Figure 11: Self-Service Portal experience on Windows Azure and Windows Server.
As you can see in Figure 11, the Self-Service Portal experience is very similar. You’ll notice right away that the color scheme is different between Windows Azure and Windows Server. As mentioned earlier in the Service Provider Experience section , the Self-Service Portal is a customizable solution that can be themed and re-branded to suit the needs of the enterprise. In this example, we’ve applied a different theme to emphasize that the Self-Service Portal running on Windows Server is a different instance from the one running in Windows Azure.
Another difference is that the Self Service Portal exposes only the services the Service Provider has included in the plan the tenant is using. For example, if a tenant has only subscribed to IaaS (including only Virtual Machines and Networking), only those two services would be presented in the tenant portal as shown in Figure 12 (see below).
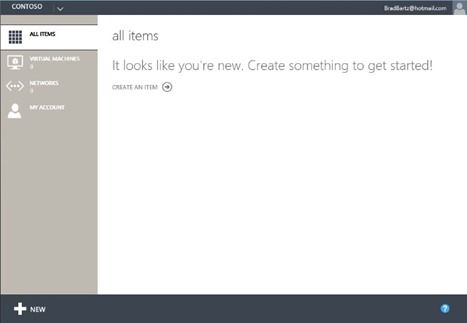
Figure 12: Self-Service Portal IaaS experience.
However, if the tenant subscription included all the services included in Windows Azure Pack and provided by System Center 2012 R2, the portal would look like Figure 13 (see below).

Figure 13: Self-Service Portal full experience.
Each tenant has a unique subscription, and the experience is tailored to the services provided on a per subscription basis.
Scenario 3: Self-Provisioning Scalable Tenant Capacity
Service Providers often ask about VM provisioning within the data center. The way this works is simple: Service Providers define hosting plans with resource quotas. These quotes then define where in the data center a resource is provisioned. This location then determines the amount of capacity that a customer can self-provision.
In order to enable self-provisioning of scalable tenant capacity, we introduced a new service model in System Center 2012 R2: Virtual Machine Roles . These are a tier of VMs that operate as a singleton. VMs in the tier exhibit a set of cloud attributes that can be scaled, operated upon, and treated as a single entity within the portal environment.
Service Providers publish Virtual Machine Roles via the gallery to enable tenants to easily provision capacity. The Service Provider is then able to scope or limit access to these gallery items on a plan-by-plan basis. This enables the Service Provider to tailor the set of applications they make available to different groups or even individual tenants. Figure 14 (see below) shows how the tenant can select a Virtual Machine Role from the gallery. In this example, the service provider has provided six gallery items in the plan to which this tenant is subscribed.

Figure 14: Creating a Virtual Machine Role from the gallery.
Virtual Machine Roles have also been modeled and designed with Windows Azure consistency in mind. One of the new capabilities in Virtual Machine Roles is the ability to scale a virtualized application. Just as with the modern website service, tenants can now easily scale their virtualized applications.
In order to enable this scenario, a Virtual Machine Role separates the application from the image – this allows the same base image to be used for multiple applications. Next, settings unique to the Virtual Machine Role define the scaling constraints for the application along with the initial number of instances to be deployed. The default values for these settings can then be defined when the gallery item is authored. Figure 15 (see below) shows how the tenant can configure the scaling settings.

Figure 15: Specifying scaling settings for the virtual machine.
In Figure 15 you’ll also notice a drop-down list for VM Size. This contains a set of Service Provider defined values for Extra-Small, Small, Medium, Large and Extra-Large. This theme of offering simplified options to the tenant consumer is in line with the same type of experience in Azure.
In addition to the scalability settings, there is a set of application-specific settings. These are uniquely defined for each gallery item. In Figure 16’s example (see below), the gallery item was authored to collect a few IIS-specific settings. The key concept to highlight here is that Virtual Machine settings are separated from the application settings. This is not merely a UX separation , it is a fundamental distinction in the Virtual Machine Role service model and package definition.

Figure 16: Specifying application settings.
After the application is deployed, the tenant will be able to manage the logical Virtual Machine Role, scale the application to handle additional load, and manage the individual instances running as part of this application. This provide a high degree of flexibility in managing the VM role independent of the application settings.
An essential feature of the Virtual Machine Role is versioning . Versioning enables the Service Provider to publish updated versions of their gallery items over time. Subscribed customers are notified when a new version is available in the portal. This allows users the option to upgrade to the new version during the appropriate servicing window. In Figure 17 (see below), the dashboard for the Virtual Machine Role indicates that there is an update available. This reminder is present in the portal because the tenant initially deployed version 1.0.0.0, and version 1.1.0.0 has been published by the provider. Tenants can choose to deploy this update during the appropriate servicing windows for the application.

Figure 17: Update notification.
As we said earlier, a unique feature of Virtual Machine Roles is the ability to scale the application. Figure 18 (see below) shows how easily tenants can scale out new Virtual Machine instances for their applications: They simply move a slider in the portal. This is a consistent experience for scalable services running on the platform throughout the Self-Service Portal.

Figure 18: Scaling applications.
Scenario 4: Troubleshooting Virtual Machines (VMs)
Another new scenario we have enabled as a part of Windows Azure Pack is a way to console connect to an inaccessible VM instance running on the fabric. This inaccessibility can have a variety of causes (the VM may have a misconfigured network, or remote desktop disabled, or perhaps the machine is having trouble during the installation or boot up sequence, etc.), and in each case the end result is critically important to address: The VM is inaccessible to the remote desktop connection client. This means that if the machine is running in a Service Provider’s data center, the customer has no way to access the machine to troubleshoot the problem.
Console Connect is a new feature delivered in Windows Azure Pack made possible by new capabilities in Windows Server 2012 R2 and System Center 2012 R2. Console Connect is plumbed through the entire stack including the Remote Desktop Connection client. When the tenant opens the dashboard screen for a VM, there is a " Connect ” command in the command bar. By default, the Connect command will simply launch the Remote Desktop Connection client to RDP to the virtual machine. If the Service Provider has enabled Console Connect, the customer will have an additional “ Console ” option on the “ Connect ” command. When the customer selects this, it launches a new RDP session on a secure connection to the new Console Connect service provided by the operator. Figure 19 (see below) illustrates this experience.

F
igure 19: Console Connect
.
In Figure 20 (see below) you can see that we have established a remote connection to a virtual machine that is waiting at the Windows Server 2012 installation screen. We are actually able to remote connect to a machine that does not even have the operating system installed!

Figure 20: Console Connect to a Windows Server VM.
As discussed in last week’s blog post discussing how we’ve enabled Open Source software , a key tenant of the R2 wave is ensuring open source software runs equally well on Windows Server. This is demonstrated in Figure 21 with the ability to create a remote desktop connection to a Linux machine.

Figure 21: Console Connect to a Linux VM.
The integration of Windows Azure Pack, System Center 2012 R2, and Windows Server 2012 R2 delivers both a Self-Service Portal experience and new services that enable Service Providers to deliver a tenant administrative experience that will delight customers.
* * *
The R2 wave has built on the innovation in the 2012 releases to provide Service Providers a rich IaaS solution. We have brought to market innovation into the infrastructure itself to ensure that the network , compute and storage , and infrastructure are not only low-cost but easy to operate through rich integration with System Center. On top of this, there is the delightful user experience for not only the IaaS administrators, but also the tenant administrators consuming IaaS.
Next week, we start a two week look at what 2012 R2 can do for Hybrid IT.
- Brad
Next Steps
To learn more about the topics covered in this post, check out the following articles. Also, don’t forget to start your evaluation of the 2012 R2 previews today!
Service Provider Experience
-
An Introduction to Service Management Automation
The Automation SMEs from the Building Clouds blog provide a detailed introduction and technical overview of Service Management Automation (SMA) and PowerShell v3 Workflow. -
How to create basic IaaS Offers in the Service Administration Portal
In this blog post, we will go into the details of how a Service Administrator can easily create IaaS offers and make them available for the tenants to subscribe. -
How to integrate your Billing System with the Usage Metering System
In this blog post, we will detail how to create a billing adaptor, to integrate the billing system of the Service Provider with the Usage Metering System. -
Creating Usage Analytics Reports using Excel
In this blog post, we will go into the details of how a Service Provider can analyze the tenant Resource Utilization, identify patterns and get insights to run their business. -
Using Server inventory reports to help stay complaint with Service Provider Licensing A...
In this blog post, we will go into the details of how Service Providers can leverage the Server Inventory report and be able use the information to plan and account for the licenses according to the Service Provider Licensing Agreement (SPLA). -
Message Analyzer
Analyze network, system events and log files all together, all in one place, with powerful correlation, diagnostic and visualizations tools.
Tenant Administrator Experience
- Learn more about Windows Azure Pack here , where you’ll find and excellent whitepaper detailing the services included in Windows Azure Pack.
You must be a registered user to add a comment. If you've already registered, sign in. Otherwise, register and sign in.