

Azure Log Analytics: Looking at data and costs
At some stage, you either need to add a new set of data to Log Analytics or even look at your usage and costs. Originally you looked at the Usage table for this data:
- https://docs.microsoft.com/en-us/azure/azure-monitor/platform/log-standard-properties
- https://docs.microsoft.com/en-us/azure/azure-monitor/platform/manage-cost-storage
As you can see from these docs (and please read them as I wont go over the content here), Usage and some of the queries have moved to a new method using Union.
Here are a few of my own that use this new technique
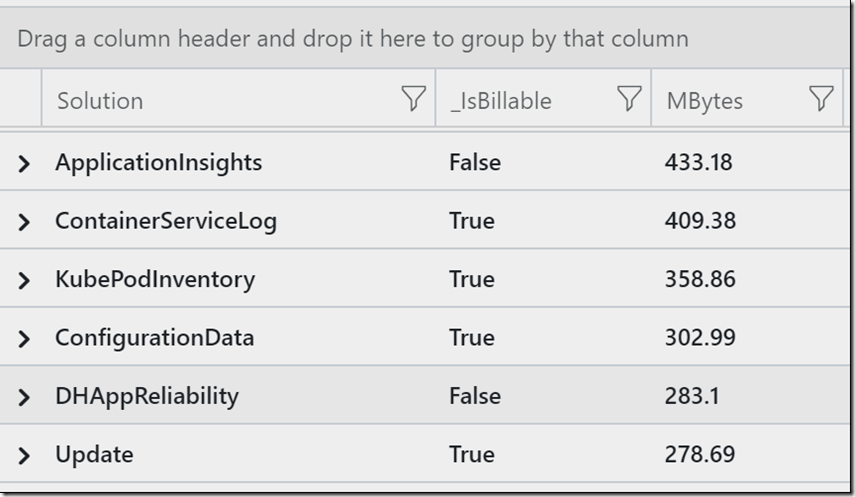
In this first example I take the sum of all bytes sent to all solutions. I have commented out the _IsBillable line as I wanted to show both data types.
A customer this week asked which solutions were free, this shows you that detail (after you have collected some data of course). However if you don’t have the data, you can check within the public Demo Log Analytics workspace.
TIP: This can be a good place to check, if the solution is chargeable before you add it to your own! or use this to gauge the likely data quantity. Also see Christoph Petersen’s blog on Data volume estimation for Log Analytics.
//MBytes sent to Log Analytics by ALL solutions/Tables
union withsource = tt *
//| where _IsBillable == true
| summarize MBytes=round(sum(_BilledSize/1024/1024),2)  by  Solution=tt  , _IsBillable
| sort by MBytes nulls last
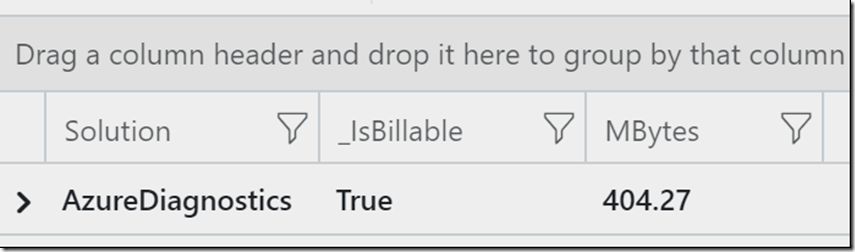
You could then use this list to identify just one solution to drill into:
let SolutionName= "AzureDiagnostics";
union withsource = tt *
| where TimeGenerated > ago(1d)
| where _IsBillable == true
| where tt == SolutionName
| summarize MBytes=round(sum(_BilledSize/1024/1024),2) by Solution=tt , _IsBillable
| sort by MBytes nulls last
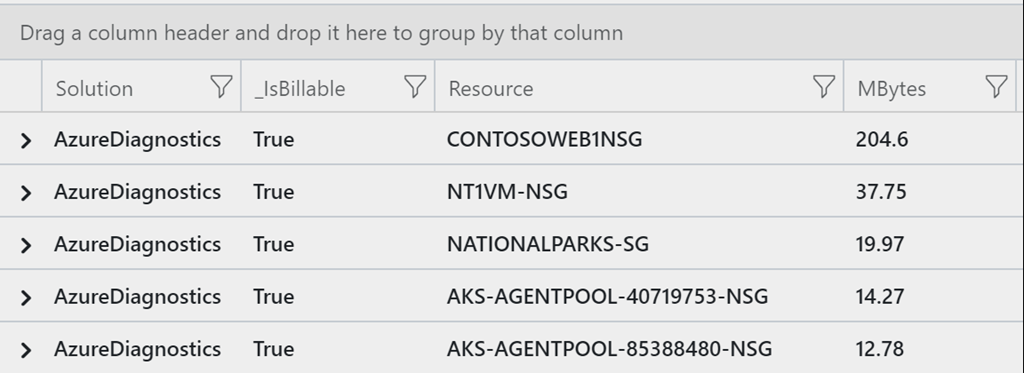
This last example builds on the last query, and looks at just the NetworkSecurityGroup (NSG) resources.
union withsource = tt *
| where TimeGenerated > ago(1d)
| where _IsBillable == true
| where tt == "AzureDiagnostics" and ResourceType=="NETWORKSECURITYGROUPS"
| summarize MBytes=round(sum(_BilledSize/1024/1024),2) by Solution=tt , _IsBillable ,Resource
| sort by MBytes nulls last
Updated query from post https://blog.peterschen.de/data-volume-estimation-for-log-analytics/
Example 1: This just shows you the data when its a billable equals True metric (see line 4).
let daystoSearch = 1d;
union withsource = tt *
| where TimeGenerated > ago(daystoSearch)
| where _IsBillable == True
| summarize
RecordCount=count(),
MbperRecord = round(sum(_BilledSize / 1024 / 1024) / count(), 4) ,
TotalMBytes= round(sum(_BilledSize/1024/1024),4)
by SolutionName = tt
| sort by SolutionName asc
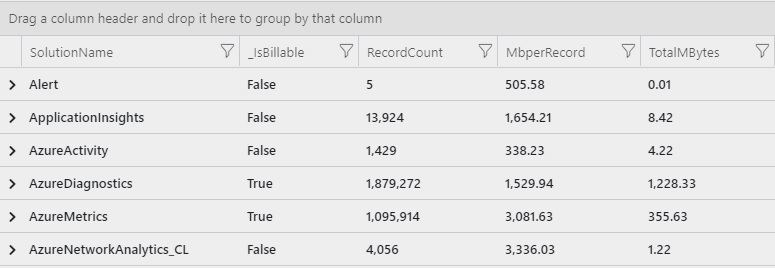
or, in example 2 we look at all data and show the _IsBillable status in a column
let daystoSearch = 1d;
union withsource = tt *
| where TimeGenerated > ago(daystoSearch)
| summarize
RecordCount=count(),
MbperRecord = round(sum(_BilledSize / 1024 / 1024) / count(), 4) ,
TotalMBytes= round(sum(_BilledSize/1024/1024),4)
by SolutionName = tt, _IsBillable
| sort by SolutionName asc
Example 2: We look at all data and show the _IsBillable status in a column.
let daystoSearch = 1d;
union withsource = tt *
| where TimeGenerated > ago(daystoSearch)
| summarize
    RecordCount=count(),
    MbperRecord = round(sum(_BilledSize / 1024 / 1024) / count(), 4) ,
    TotalMBytes= round(sum(_BilledSize/1024/1024),4)
    by SolutionName = tt, _IsBillable
| sort by SolutionName asc
Updated
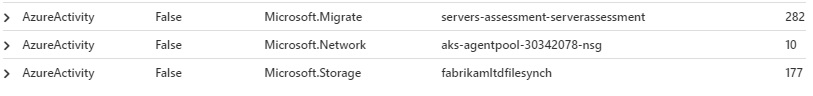
Sometimes it’s also useful (thanks Jason Hall) to see the Azure services and resources that are emitting the data. If you only want to look at one solution, please edit line 5.
// Data Usage + identify the resources emitting data
let daystoSearch = 1d;
union withsource = tt *
| where TimeGenerated > ago(daystoSearch)
//| where tt == “AzureDiagnostics” // look for a specifc solution?
| summarize
    RecordCount=count(),
    MbperRecord = round(count() / sum(_BilledSize/1024/1024),2) ,
    TotalMBytes= round(sum(_BilledSize/1024/1024),2)
    by SolutionName = tt,
_IsBillable, // is this billable data?
ResourceProvider, // what Azure Service
Resource // what entity in that service
| sort by SolutionName asc, TotalMBytes
You can also add ResourceGroup (for AzureDiagnostics):
// Data Usage + identify the resources emitting data
let daystoSearch = 1d;
union withsource = tt *
| where TimeGenerated > ago(daystoSearch)
| where tt == “AzureDiagnostics” // look for a specifc solution?
| summarize
RecordCount=count(),
MbperRecord = round(count() / sum(_BilledSize/1024/1024),2) ,
TotalMBytes= round(sum(_BilledSize/1024/1024),2)
by SolutionName = tt,
_IsBillable, // is this billable data?
ResourceProvider, // what Azure Service
Resource , // what entity in that service
ResourceGroup
| sort by SolutionName asc, TotalMBytes