

Azure Log Analytics: looking at data and costs – Part 2
Part1: https://www.microsoft.com/en-gb/industry/blog/cross-industry/2019/03/28/azure-log-analytics-looking-at-data-and-costs/
Part2: This post
Part3
Part4:
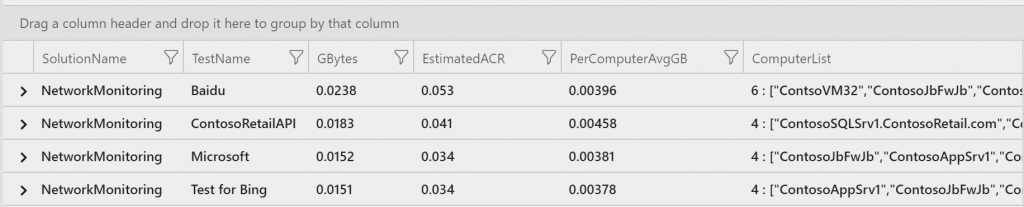
Sometimes you get an obvious question but it takes a while to work through the details, in this case Vlad wanted to know how much data each Service EndPoint Monitor (NPM) Test produced and the cost. So this is a modified version of my KQL code from part1.
In the previous article I’ve never introduced a cost estimate just data volume, but you can see that is possible. I have 31days+ of data in the demo portal (free for you to use as well), so its a good place to get an indicative estimate of Azure Services. However please note your real consumption in your own workspace may vary considerably, so also validate this against your own Log Analytics data.
let aap = 2.229;  //Add Azure Pricing

union withsource = tt *

| where TimeGenerated > startofday(ago(31d))

| where _IsBillable == true

| where tt      == "NetworkMonitoring"  // look for a specific solution?

| where SubType == "EndpointPath"       // look for endpoint tests

| summarize

GBytes           = round(      sum(_BilledSize/1024/1024/1024),4),

EstimatedACR     = round(aap * sum(_BilledSize/1024/1024/1024),3),

PerComputerAvgGB = round(      sum(_BilledSize/1024/1024/1024) / dcount(Computer),5),

ComputerList     = strcat(dcount(Computer)," : ", make_set(Computer))

by  SolutionName = tt , TestName

| sort by GBytes nulls last
The first line, adds in the pricing details – see the entries for your currencies in the Azure Pricing Calculator – I have used £ (GBP) as of May 2019. This is the Log Analytics per GB price.
Lines 5 & 6 are specific to NetworkingMonitoring and the Tests – obviously you can filter on other Azure related data points.
Please see part 1, which describes how to list all the Azure Services.
The line that starts “summarize” does the calculations for GB data used, an estimate of how much that costs (ACR = Azure Consumed revenue) and also a price for each EndPoint Test averaged over the count of computers. There is a column that also shows the count and list of computers, which was useful whilst I was working on the query, but you might remove it when you are happy with the results.
You can run the above query in the Demo portal from this link
Another example, similar to the ones in Post 1 would be:
// 31days of info, shown by MB and total GB
let daystoSearch = 31d;
union withsource = tt *
| where TimeGenerated > startofday(ago(daystoSearch))
| where _IsBillable == True
| summarize
RecordCount=count(),
MBperRecord = round(sum(_BilledSize / (1024 * 1024)) / count(),4),
TotalGBytes = round(sum(_BilledSize / (1024 * 1024 * 1024)),4)
by SolutionName = tt
| sort by TotalGBytes desc
Azure Sentinel pricing estimates require you to know your GB number (if you have the data in Log Analytics)
//Disclaimer: All prices shown are in USD ($). This is a summary estimate, not a quote.

let aap = 2.30; //Add Azure Pricing ($ USD) source: https://azure.microsoft.com/en-us/pricing/details/monitor/

let daystoSearch = 31d;  // Enter, how many days worth of data to look at?

union  withsource = tt *

| where TimeGenerated > startofday(ago(daystoSearch))

| where _IsBillable == True

| summarize

TotalGBytes =round(sum(_BilledSize/(1024*1024*1024)),2),

EstimatedCostUSD=round(aap * sum(_BilledSize/(1024*1024*1024)),2),

OldestRecord=min(TimeGenerated), NewestRecord=max(TimeGenerated)

by Solution=tt

| sort by TotalGBytes desc

| summarize TotalGB=sum(TotalGBytes), TotalCost=sum(EstimatedCostUSD)