

How to measure and reduce the carbon footprint of your application

I’m a green software engineer, and the first principle of green software engineering is to build applications that are carbon efficient. That means for each gram of carbon our application is responsible for emitting into the environment, we try to extract the most value from that gram as possible.
So, in this context, the first metric you might think of is carbon. And although we do need to calculate the carbon emissions of our application at some level, it’s particularly hard to measure. There’s no HTTP response header that returns the carbon cost of the request (maybe there should be?), so most of what we do is try to model. When we model, we make assumptions, and those assumptions might impact where we put efforts to optimise.
For example, a common challenge is the carbon intensity of electricity. Electricity is dirty and it emits carbon in its creation – how much carbon it emits is known as carbon intensity. The global average for carbon intensity produced in 2020 was 519g/kWh, but each electricity grid in the world has a different number because each grid has a different mix of clean and dirty electricity sources. It also changes over time, so each minute in each region has a different carbon intensity. Which of these numbers is the right one to use when calculating your carbon metric?
If you choose a global yearly average and try to save carbon by running your application in a region with cleaner electricity, that change won’t be reflected in your carbon metric.
If you decide to include real-time regional carbon intensity numbers in your calculation, then imagine this scenario; You release a code change and your carbon metric goes up. Did your code change make the application worse or has the electricity become dirtier? In this scenario, the real-time carbon metric is a problem as it’s causing false positives.
At the same time, perhaps you released a code change that shifted workloads to times and regions when the electricity was cleaner. If this was the case, then you’d want your carbon metric to use real-time regional carbon intensity numbers to tell you your code change had a positive impact.
It’s good to attempt to model and think of the overall carbon number of your application, but be aware of how that number is being calculated and what assumptions are being made.
Look for carbon proxies
An easier solution is to look for carbon proxies. If you can somehow connect what you are measuring to carbon, then it’s a proxy. And optimising for that metric is optimising for carbon.
For example, let’s take a look at electricity. We burn fossil fuels to make electricity, meaning there is a connection between electricity and carbon. This makes electricity a carbon proxy. Therefore, reducing the energy consumed by your application reduces the amount of carbon it’s responsible for emitting.
How to choose carbon proxy metrics
The metrics you choose will open the doors to optimisations as if you measure something, you will usually aim to optimise it, so picking the right measurement criteria is key.
Our goal as green software engineers is not to write reports, it’s to implement change. We need information to know what these changes should be. When picking a carbon proxy, be less concerned about how accurately you can measure it, and more concerned about the directional information the proxy gives you. It’s OK if your units are off, and it’s OK if it’s not accurate. As long as the metric behaves in a way that gives us the right information to make the right choices, it’s good enough.
What you choose to measure will impact what you will optimise, and because of the assumptions that need to be made when summarising, multiple metrics are better than one.
Some metrics are easier to measure than others: pick what’s manageable at the start, add others as you refine your green software engineering methodology.
What carbon proxy metrics should you choose for a website?
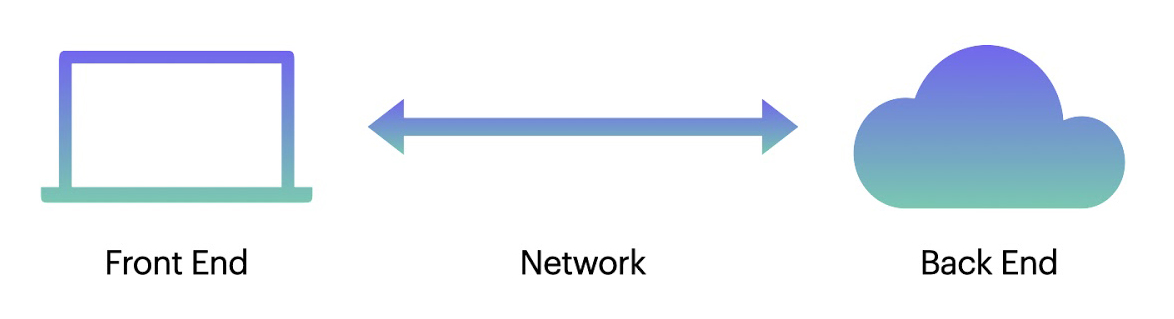
Let’s take a look at what metrics a website might need. We’ll pick a reference architecture of a basic multi-page application (i.e. most websites). Every time a user clicks a link, the browser makes a request to the server, the server generates some HTML and returns it in the response which the browser then renders on the client machine.
We have a frontend running on a client machine, some networking, and a backend running on some servers. We assume the application is not a bitcoin miner or a game – essentially once parsed and loaded in the browser, the application is not running constantly and taking up CPU.
So, what are some good carbon proxy metrics we might choose to measure for this application?
Frontend
For the frontend, the ideal carbon proxy would be the total energy used to render the webpage. There are tools to measure this, however, pulling that all together into an automated measurement system is not easy. Another carbon proxy we can then use is time-to-interactive. This is the time it takes from the response being made to the page being rendered and usable on the client device. We’ll make the assumption here that the energy used is proportional to the time, though this might not always be the case.
A lower time-to-interactive implies an application that:
- Consumes less electricity – and electricity is a carbon proxy (see the second principle of green software engineering).
- Has more efficient code. The more efficient the code, the better the application will perform on older hardware. The more we can make our applications work well on older hardware, the less pressure we put on society to throw away perfectly good devices just to buy newer, faster machines to meet the demands of the latest software. Hardware releases carbon in its creation so hardware is a carbon proxy. This speaks to the fourth principle of green sustainable software engineering: embodied carbon.
We can connect time-to-interactive to carbon through two other carbon proxies (electricity and hardware), so time-to-interactive is also a carbon proxy.
Networking
What is the carbon cost of networking? It’s difficult to measure and there are competing models, but suffice it to say, two things are true.
- The larger the size of data you are transmitting, the more energy and compute it requires to transmit. Therefore, data size is a carbon proxy.
A good metric to choose here for websites is page weight – the overall size of all the assets in your website. Page weight is a carbon proxy.
- The more distance the data has to travel, the more compute and energy is needed. Therefore, the distance that data has to travel is also a carbon proxy.
The distance is a difficult one to factor in since it depends on where your users are located and the location(s) your requests are being served from. Are your users globally distributed? Are they mostly in the UK? It’s possible to measure, but as you can imagine, measuring accurately is not going to be simple. You really want the average distance that each MB of your data had to travel across the network to reach its end customer.
This is one of the cases where we can spend a lot of time figuring out the most accurate value when what we need might just be directional information. Average Server Response Time is something that analytics tools can measure; they define it as ‘the time for your server to respond to a user request, including the network time from the user’s location to your server’. It’s fair to assume that the less distance the data has to travel to the user, the faster the server might respond with the data. Average Server Response Time can therefore be a carbon proxy and something we can measure in our application.
Backend
We require compute to serve your website; these things are called servers. Servers are hardware and have embodied carbon as they released carbon in their creation. Therefore, servers are carbon proxies. The fewer servers we use, the less carbon is emitted.
Azure compute units
So, a metric here is, simply, the number of servers. But not all servers are the same. Some are faster, larger, and some released more carbon in their creation than others. The ability to easily compare and contrast servers is a common problem. In Microsoft Azure, one thing we do is talk in terms of Azure Compute Units (ACUs). Each server that you can buy on Azure has an ACU number associated with it; ACU is how you compare the power of one server to another. For example, a server with an ACU of two is equivalent to two servers with ACUs of one. The list of ACUs for Azure can be found here.
Another way to look at it is that the number of servers is like the number of cars, and ACUs is like total horsepower.
So, on Azure at least, the number of ACUs is a better measure than the number of servers. This gives a good proxy for the volume of compute.
We can connect the dots from ACUs to servers, and servers to carbon, so ACUs are a carbon proxy. By optimizing for ACUs, we optimise for carbon.
Cost
What about other services like the database, storage, etc.? If someone else is running your database for you, you probably don’t have certain information, e.g. the number of servers being used underneath; you may only have the number of requests or some other higher-level metric.
One metric that would seem to cover all of the above is cost. At some level, the embodied carbon and electricity costs of all your compute are factored into the cost of all your services. We can connect the dots between the cost of a service and the carbon produced. Therefore, cost is a carbon proxy. Optimising for cost is optimising for carbon.
Utilisation
The global average on-premise server utilisation is about 15%. This means that, on average, most servers are idle. This has broad carbon implications on the following proxies:
- Embodied carbon. 85% of the carbon released in the creation of the server is wasted.
- Energy efficiency. The more you use hardware, the more efficient it becomes at turning electricity into useful operations. This is the fifth principle in green software engineering.
We can therefore connect the dots from server utilisation to carbon through several principles, meaning that server utilisation is a carbon proxy. The more we increase server utilisation, the less carbon is released into the atmosphere.
Don’t just use one metric
The first philosophy of green software engineering is that everyone has a part to play in the climate solution.
And every role in a web development team has a part to play in the overall sustainability of their application. The relative importance of different roles in the overall carbon efficiency varies: in the early stages of a site, the backend engineers may overshadow the frontend; as a website becomes more popular, the frontend outweighs the backend.
Every project is different, but consider picking several carbon proxy metrics that cover a broad set of roles. You want metrics that give everyone in the team an opportunity to play a part in the solution.
Azure’s move to carbon-free energy
Remember, if the energy that you consume is carbon-free energy, then your application is carbon-free. This is the reason that why the Azure datacentres are moving to 24/7 carbon-free energy from 2025.
There is, of course, one caveat: even if the datacentres only consume carbon-free energy, there is still carbon generated in the manufacturing in the equipment being used, such as servers, cables and racks. This is the reason why Microsoft is also putting a lot of effort into reducing embedded carbon and becoming a zero waste company by 2030.
Greener means better, faster, cheaper
This leads me to my last point, and one I really want to press home. Let’s look back at the metrics we have chosen to make our web application green.
- Time-to-interactive. The lower the better.
- Page weight. The lower the better.
- Average server response time. The lower the better.
- Cost of your services. The lower the better.
- The utilisation of your servers. The higher the better.
By improving time-to-interactive, page weight, and server response time, we make our applications faster. Reducing cost and increasing utilisation makes our applications cheaper. There is a lot of overlap between making an application greener and making an application faster and cheaper. Across the board, the greener solution is one that is almost always better than its grey counterpart in many dimensions.
We take advantage of this fact as much as possible, but the primary reason we do this – and the reason green software engineers get up every day with a passion for their work – is sustainability. Everything else is an added advantage. And that’s the second philosophy of green software engineering: sustainability is enough, all by itself, to justify our work.