
Changing the data conversation in San Jose
Power BI empowering cities – Part 1
While the City of San Jose may be the capital of Silicon Valley, it is achieving success with a data analytics solution born in Redmond, Wash.
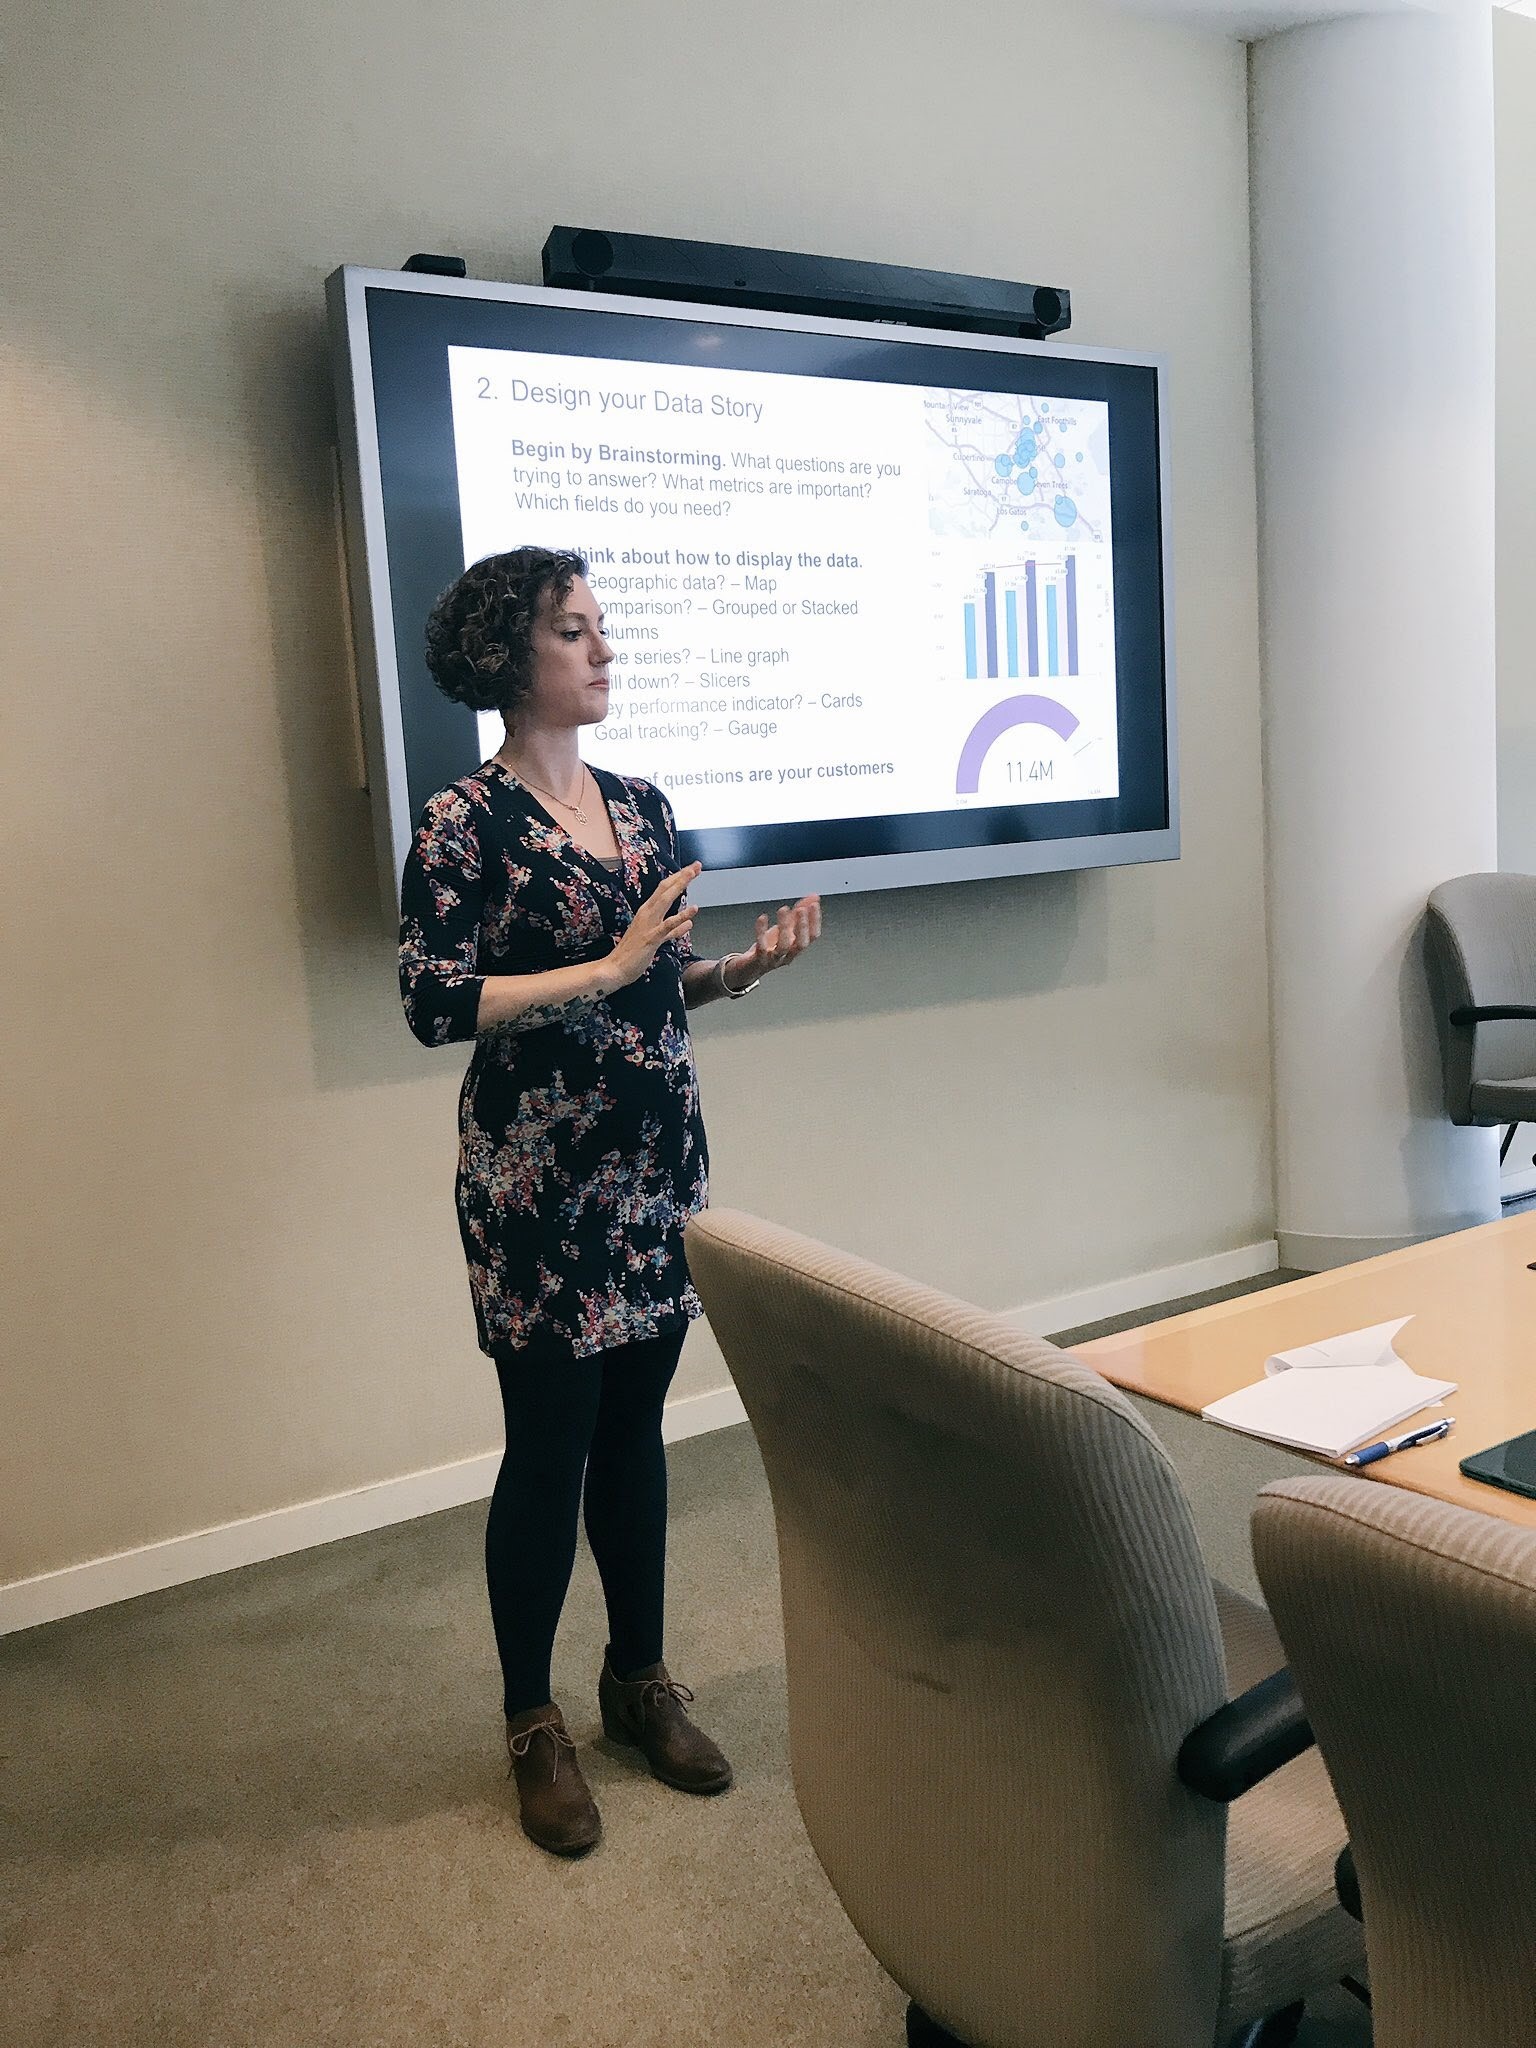
According to Erica Garaffo, data analytics lead, San Jose’s Power BI journey began in August 2016. “I really kind of fell in love with (Power BI),” she said. “I liked the possibilities of what it could do … the ability to mesh different data sets, that you could connect to online sources. I was using some of those features in Excel, but Power BI just took it to the next level.”
Bringing data to life
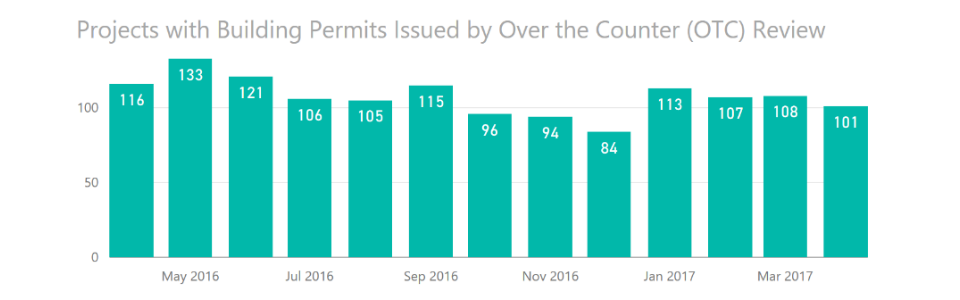
 As part of the Office of Civic Innovation & Digital Strategy, Garaffo is spearheading the move to Power BI among the California city’s data analysts. She vividly recalls how Power BI shifted the conversation of a September 2016 city council committee meeting on Development Services, which includes building, planning, public works and fire departments. Mayor Sam Liccardo had requested the department display its permitting activity in a visual dashboard instead of the tabular format previously used. Garaffo worked with Microsoft’s Michael Cruz to develop the Power BI dashboard: “It took a little bit of effort because the underlying data was sort of duct-taped together … but it was a good first step,” she said. “It was the first chance to really show … the power of Power BI in bringing data to life” and demonstrate how the city was expediting its development process.
“What was really powerful to me … was seeing the director of (Development Services) and the mayor pointing up at the screen, talking about the data,” she added. “It changed the conversation to be data informed. That was really inspirational.”
Streamlining financial reporting
 After Cruz conducted a Power BI “Data Champions” lunchtime talk followed by a half-day “Dashboard in a Day” workshop, a Parks, Recreation and Neighborhood Services (PRNS) supervisor chartered an analyst to learn Power BI to streamline the department’s monthly financial reporting. Garaffo explained that PRNS is “a very distributed, decentralized department,” with hundreds of parks, community centers and programs. “They’re very good at managing their budget to a very detailed level,” she said. “But because of the way that our financial management system spits out data, it required a lot of effort for the financial analysts … to consolidate the reports, pivot them and do year-over-year comparisons” for each manager. By using Power BI, the PRNS finance reporting now takes just 2 hours per month instead of two analysts spending half their time on the monthly process.
“The implication for what (PRNS) has done for the city is pretty groundbreaking,” Garaffo said. “This is one department doing financial data visualization—but this is data that is used by every single, other department,” providing a template that all departments can use to visualize their own data with Power BI.
Turning on data liquidity
Garaffo recently conducted another Data Champions session highlighting the Parks, Recreation and Neighborhood Services Power BI work and a deeper dive into the city’s financial data. She’s also planning on having Cruz lead a second Dashboard in a Day session, followed by “a much more targeted training curriculum on Power BI” to enhance the skills and professional development of the city’s analysts.
Garaffo said it’s been encouraging to hear from employees who want to learn Power BI for “examples that I couldn’t have even imagined.” She’s also excited about Power BI’s ability to connect directly to the city’s data source, replacing a reliance on static reports. “(Power BI is) turning on that internal data liquidity between city departments and breaking down those silos so that the data can be shared easily,” she said. “Now we’re turning on the faucet so that folks can connect directly to the raw data. We are not just changing the data analytics piece, we’re also changing how we’re consuming data in the city and that’s going to be really transformative. It all starts with the data and patterns, and Power BI makes that easy.”
In addition to San Jose’s story, please learn more about how Microsoft CityNext is empowering cities with Power BI in these Real Stories of Digital Transformation: