

Episode analytics now mission critical as outcomes meet incomes
Partners HealthCare paves volume-to-value path with late-binding data warehouse
The tipping point for value-based care is near
It’s no secret that CMS intends to drive the market toward alternative payment models that reward value, quality, and outcomes over volume. But I think there’s a far more powerful driver that’s likely to make value payment models mainstream faster than CMS: the rude awakening that every health system board is facing—that their expense growth is inexorably outpacing their revenue gains.
That rude awakening is making risk sharing contracts with commercial payers and Medicare’s recently announced voluntary bundled payment program for episodes of care look like the welcome lifeboats health systems need to rescue themselves from the negative margins the CBO is forecasting for 60 percent of systems by 2025.
But just how ready are most health systems to really handle bundled care episode contracts with two-sided risk? By now, most health systems have acquired the tools to stratify patients by risk and generate gaps in care reports for the task lists of care managers. But my guess is that there’s just a handful that really know how well their system will perform—financially and clinically—for CMS’s two-sided risk bundled payment program that spans inpatient, outpatient, and post-acute care settings. And even fewer can track, let alone manage, the clinical variation of every provider and facility involved in those 90-day episodes of care.
My take is that most are nowhere near where they need to be to re-grow their collapsing margins with bundled payment contracts.
Found: A care episode analytics outlier
So, it was a pleasant surprise when I recently came across a health system that had not only designed an innovative solution to manage episode of care risk down to the provider and facility level, but had fully operationalized it: Partners HealthCare System. I was particularly interested in finding out how it managed to quickly and affordably stand up a solution that was scalable and flexible enough to track and manage the full 48 episodes of care defined by CMS.
To find more about what was under its technology hood, I sat down with Partner’s Vice President and Chief Population Health Officer, Sree Chaguturu, MD. Below is a transcript of that conversation.
Schmuland: Could you briefly describe Partners HealthCare as an organization, and your vision for population health and episodic care analytics?
Chaguturu: Partners HealthCare is an integrated delivery network made up of two large academic medical centers (AMCs)—Massachusetts General Hospital and Brigham and Women’s Hospital, roughly eight community hospitals, one specialty hospital, more than 10 community health centers, five major multispecialty ambulatory sites, inpatient and outpatient psychiatric and rehabilitation specialty services, home care, and more than 6,500 physicians.
Our population health journey started back in 2011, when we were selected to participate in the CMS Pioneer ACO model. The next year, 2012, we added commercial risk contracts covering over 300,000 patients and Medicare risk contracts covering about 100,000 patients. That quickly pushed us from a shared savings arrangement toward a population-based payment model. So, it didn’t take long for us to realize that improving our clinical and quality performance would be all for naught if we couldn’t measure, track, and deliver feedback to every provider and facility on their clinical and financial performance for each episode of care. But what made this particularly challenging was that the at-risk episodes for each ACO participant spanned the entire continuum, from inpatient stay in an acute care hospital to post-acute care and all related services up to 90 days after hospital discharge.
Schmuland: I understand that you chose Health Catalyst to partner with you to design and implement your episode analytics solution. What was the process that led you to select Health Catalyst?
Chaguturu: To get our arms around our total clinical and financial performance across the continuum of care, we knew we needed a comprehensive episodic care analytics solution that could pull and join performance data from multiple sources that were never designed to be joined together: data from hospitals, providers, and patient claims. Data on each individual patient wasn’t sufficient to give hospitals, post-acute facilities and providers feedback on their performance for each episode of care. We had to pull together performance metrics across a representation of cohorts to get an accurate view of performance by facility and provider. Unfortunately, there were no packaged solutions to be found. So, we had to find a partner that could quickly design and stand up a data warehouse that included clinical, quality, and financial data from diverse internal and external sources, and then chunk that data into care episodes and report performance by cohorts.
Schmuland: That’s an immense scope—and a risky undertaking for any organization. How did you break this project up into stages and quick wins?
Chaguturu: Our enterprise data warehouse (EDW) today incorporates more than 27,000 data objects from multiple disparate sources—EHRs, clinical and financial systems, claims, EMPI, and external sources—so we had to break it up. The first step—which we saw as foundational—was to pull the disparate sourced data into an EDW in a way that would enable us to build products as we needed them on top of the EDW. Health Catalyst enabled us to do this with their Late-Binding EDW model, which enabled us to focus on getting the data in first, rather than trying to clean and structure the data before adding it to the EDW. This allowed us to house common financial and clinical data from the beginning within one centralized repository and use common linkable identifiers to join patients and provider data later as needed for each product. If we had used the more conventional atomic model where you define the data model in detail upfront, we would have had to invest an enormous amount of upfront time and labor in data definitions, acquisition, cleaning, structuring, and integration.
With the foundational warehouse in place, we were able to quickly create data maps and visualizations to gain insights into care episodes by patient, facilities, providers, and cohorts. We can see the big picture but also detailed views into the true cost and utilization of all aspects of care related to a clinical event, whether that care is delivered within Partners HealthCare or externally. And we’ve built in graphs of the average spend per bundle across service providers and sites of care, stratified by categories of inpatient, outpatient, professional, additional, and others.
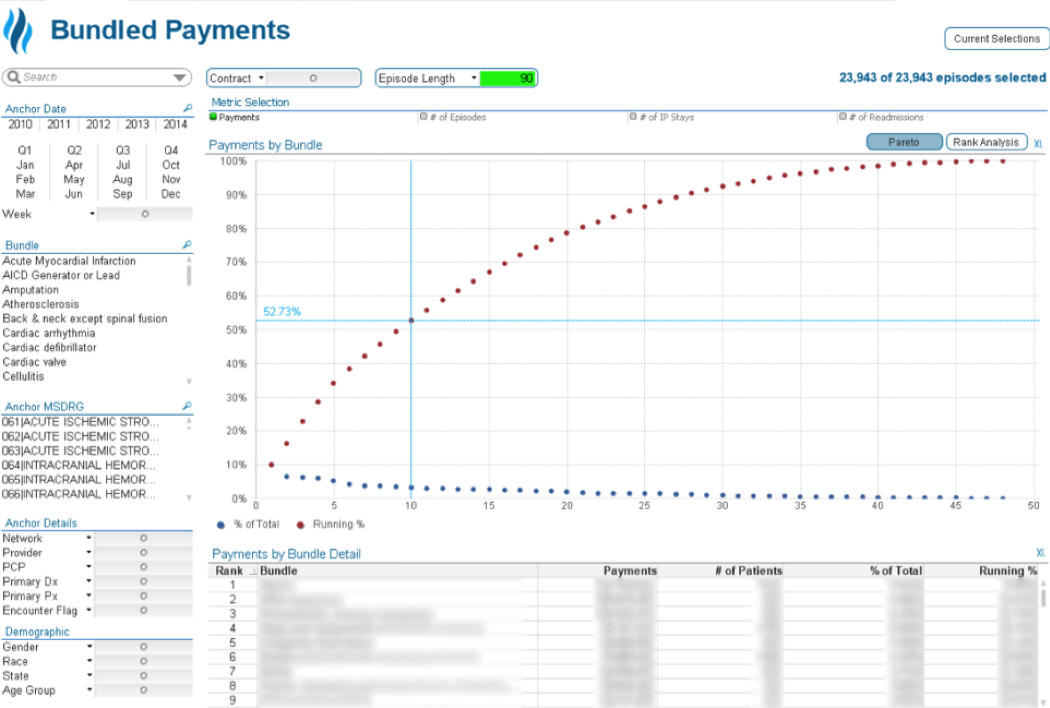
Figure 1: Sample Bundled Payment Visualization
Schmuland: Has the solution given your providers any new insights into their performance?
Chaguturu: Yes. It’s now easy for any service provider to select two or more providers and compare their average spend and potentially identify opportunities for improvement that could be gained by standardizing care approaches, diagnostic testing, supplies, or even equipment used for a group of patients. This gives Partners the ability to identify and reduce unnecessary variation in the care routines of providers and see how much outcomes actually improve when patients receive the best evidence-based practice interventions.

Figure 2: Sample Bundled Payment Variation Dashboard
Schmuland: Looking back through the rear-view mirror, what would you say was the critical success factor for the project?
Chaguturu: Governance with the appropriate representation (clinical, technical, revenue cycle) was key to this process. We invested quite a bit of energy in designing and socializing example use case analyses to rapidly gain buy-in at the executive level of each organization. The use case analyses also helped us identify which databases and data sources needed to be integrated to provide the highest value insights. Once the data was in, we were able ask the right questions, standardize datasets, and present insights to stakeholder groups. We also had the opportunity to leverage an internal demand management process which enabled us to source priority areas that had been identified across the enterprise.
To be successful, we knew we had to address the needs of all of our entities, from our Academic Medical Centers to our community physicians; we needed to deliver value to all stakeholder groups. We also opted for a self-service approach model, which, while requiring an investment in training, has helped reduce burden on our data analysts, further engage operational leaders, and provide overall performance transparency across service providers. The EDW is highly utilized today by nearly a thousand users with roughly 7.2 million database queries since inception in 2014.