
Measuring innovation value in the digital era
A notification appeared on my phone – Amazon, JP Morgan Chase, and Berkshire Hathaway had just joined forces to create a new healthcare company. As I sipped my coffee, I realized that hey, there was no healthcare company in there, and none of those companies have any experience in healthcare. What about core competencies? Isn’t that how we drive value in organizations? As many of you have heard me say, the digital era doesn’t conform to our traditional sense of order and linear predictability.
In my first blog, Organizing to create business innovation in the digital era, I compared traditional physics to quantum mechanics to provide an analogy; in the digital era, we solve problems that present much more ambiguity than those that can be handled by traditional methods. To meet this level of change and unpredictability in business, we need to consider new approaches to how we organize and optimize for innovation.
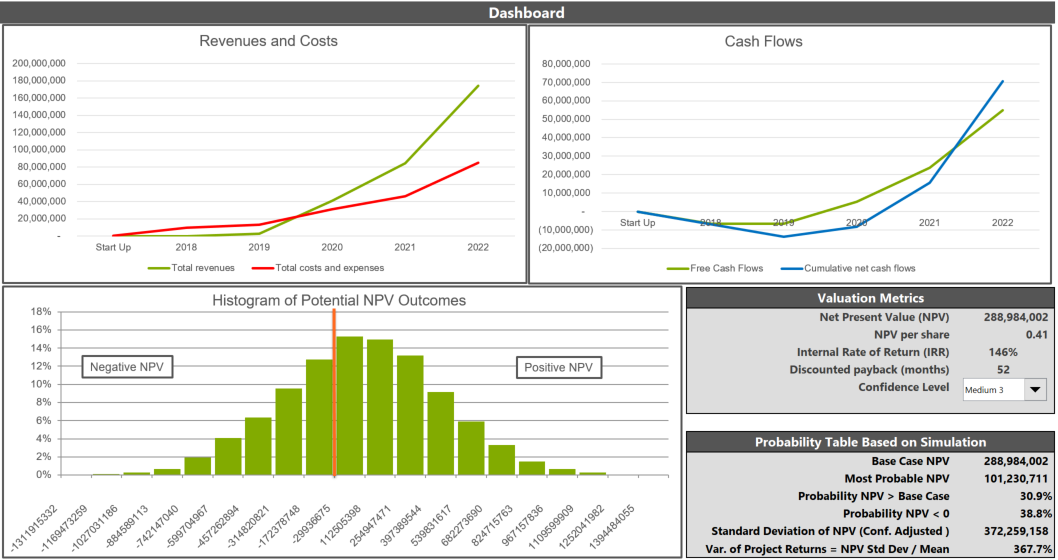
 The digital era also requires new approaches to evaluating innovative business opportunities. Traditional business case projections – often quantified as Net Present Value (NPV) or Internal Rate of Return (IRR) – present a single point prediction of future outcomes and suggest a high level of certainty. By comparison, in the unpredictable digital era, organizations need to simulate and consider ranges of outcomes which may be described as base, low, and high cases. As leaders consider innovation value using this approach, they may ask questions such as, “What is the probability of achieving an NPV that is greater than the Base Case?”, or “What is the probability of a negative NPV?”
Recently, I worked on a financial model for a project as part of a collaboration with a European manufacturer. The histogram in the dashboard below shows the range and distribution of the potential outcomes for a project’s NPV. While the probability of exceeding the base case NPV is 31%, the probability of a negative NPV is 39%. Traditional economic theory would solely focus on the positive NPV, which at 31% is much higher than 0%. In the digital era, by considering the significant likelihood of a negative NPV, the decision makers would most likely refine the scenarios further before approving the project.
Microsoft Digital Advisors help executives envision new investment scenarios and approaches. Together with customers that are looking to bring innovation into their companies, we hold envisioning sessions, identify scenarios, assess their potential value, and then prioritize. Measuring innovation value is critical to the prioritization and overall success.
There are many ways to communicate the potential value of new scenarios and the Portfolio Bubble Graph does a great job at visually communicating the range of opportunities and their value, and generating discussion about which scenarios represent the biggest opportunity and how to prioritize.
 I use bubble graphs to generate discussion and ideas about which scenarios represent the biggest opportunity, and how to prioritize. For example, if the scenario ‘Increase Revenue from New Digital Services’ on the top right (in the strategic and new digital quadrant), were chosen for further development, a work plan and pilot would be established. Since digital culture requires us to be agile and iterative, I encourage customers to continuously re-evaluate the business opportunities as they understand more and acquire more information.
In case you were wondering about what happened with the manufacturer I mentioned earlier, we used the bubble graph to flesh out ideas for new equipment leasing services. After the session, we refined several scenarios further and came up with a final investment model. The decision was made to pursue the investment based on the significantly high probability of a positive NPV.
Next time you’re called upon to estimate innovation value, I encourage you to use these models and graphs to provide information that overcome the limitations of single-point estimates.
About the author
Bill Hubbell is a Senior Economist within Microsoft. Digital Advisors bring their expertise, as well as Microsoft’s resources, experience and innovation, to empower organizations to reach their digital aspirations. For more information, please visit: Microsoft Digital Advisory Services.