
SandDance, the open source data visualization tool from Microsoft Research, is launching several new features in version 3.
Facets on all chart types
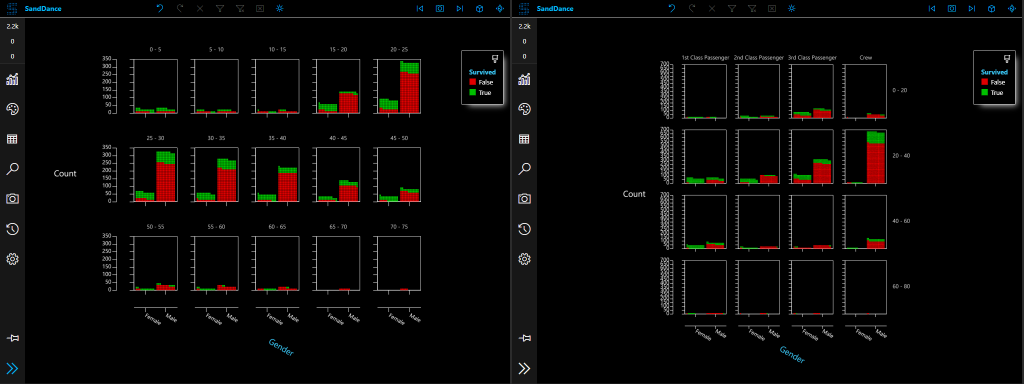
We’ve added much more control to faceted data. All chart types now have the Facet By column feature. When a Facet By column contains quantitative data, you can specify the number of bins. Facets can be arranged in a wrapped layout or in an x-y layout using two columns with the new cross-facet feature:
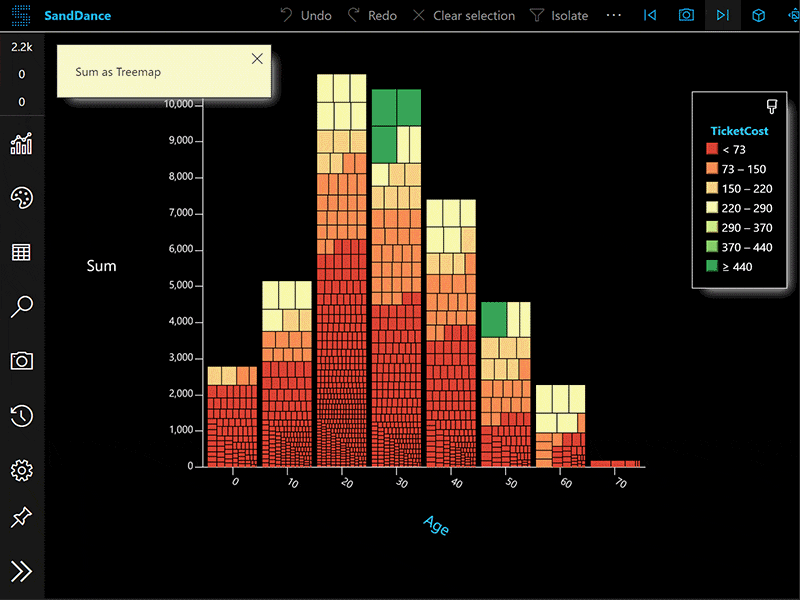
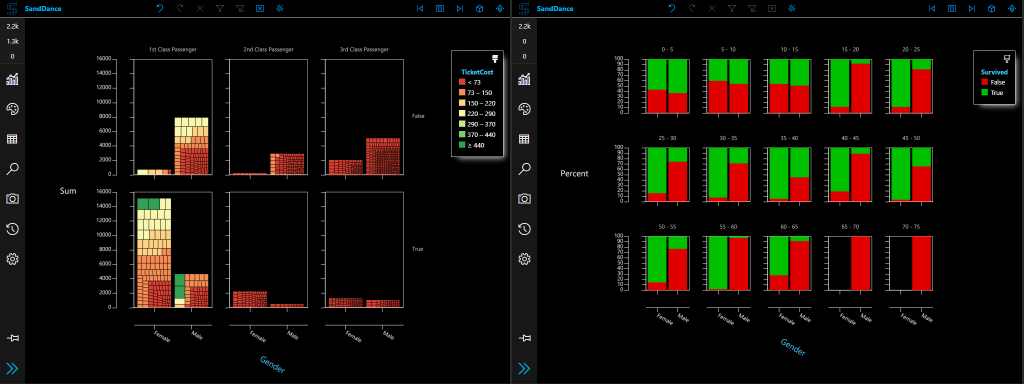
Sum aggregation
The Density, Column, and Bar charts now have a Total By column that lets you choose between either a count or a sum operation. A count will size every data element the same. A sum will vary each element’s size via the Size By column. Sums can be laid out as Treemaps or in our new Strip layout as either a count or a percentage:
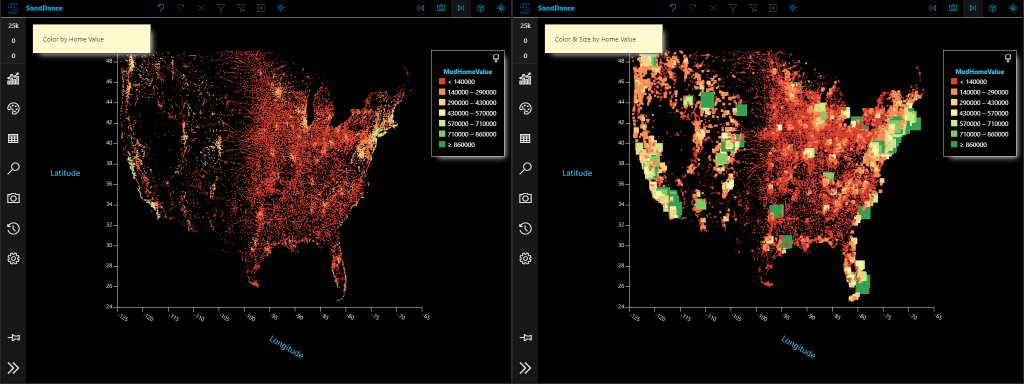
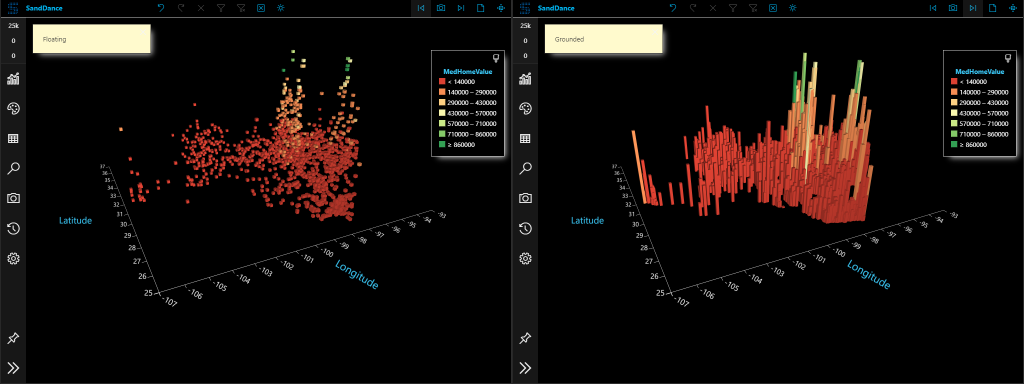
Scatterplot updates
There is now an optional Size By column mapping.
In a 3D layout, data elements can either “float” in z space or be “grounded” and use Z for their height:
3D Lighting
The lighting source is now emanating from the camera, so there is no “dark side” effect as in the previous version.
History stack
You can now undo/redo changes you’ve made along your data exploration journey. Use control-z to undo and control-shift-z to redo. Or, you may jump to any point in the list on the History tab.
Snapshots
A snapshot can have a note associated with it. You can annotate each step of your data story and page through with the snapshot arrow buttons in the top bar.
In the web app, Snapshots can be imported and exported as a .json file, or converted to an HTML or markdown page.
Community additions
As an open source project, we are proud to have contributions from members of our community. We’d like to thank these two developers with these great new integrations:
SandDance was created by Microsoft Research’s Visualization and Interactive Data Analysis (VIDA) group, which focuses on a human-centric approach to working with data, exploring areas such as data visualization, immersive analytics, and understanding of machine learning models. You can learn more about their work here.
Learn more about the new SandDance project on GitHub or our companion website. Here, you can try SandDance on any local dataset (nothing gets uploaded to the server), as well as find instructions for building local versions or incorporating it into your own projects.