
Over the past several years, microservice architectures have become the norm when building cloud-native applications. What is often overlooked are the challenges developers face when working on a microservice-based app: by decoupling the app into multiple services, there are now more pieces to develop, debug, and manage. Debugging applications that depend on multiple services requires knowledge on how to configure, source, and run each microservice. Replicating the environment on your local machine becomes complex and, in some situations, not possible due to limited dev machine resources.
The good news is, we have been working on a solution to help address these types of challenges.
In partnership with developers from Red Hat, we are announcing the introduction of Local Tunnel Debugging for Kubernetes service in the Kubernetes extension for Visual Studio Code, which enables you to use your native development tools against any cluster, live.
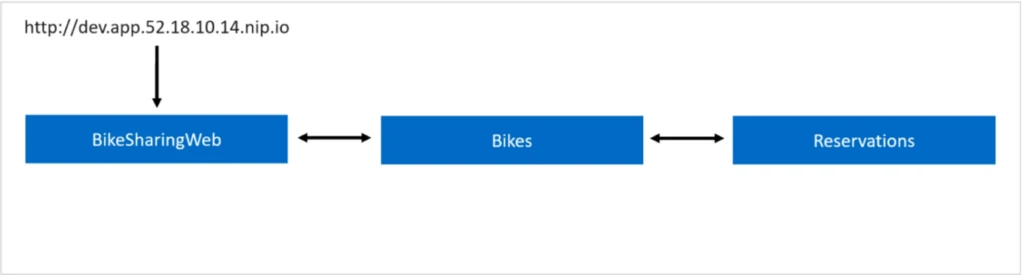
With Local Tunnel Debugging, you can run your app’s microservices natively on your development machine, using the same development tools you have always used, while tunneling to a Kubernetes cluster where the rest of the application and the other services are running. Requests initiated through the application will route between services running in the cluster until the service you are debugging is called. The request is then redirected to your development machine, to your locally running version. Local changes are executed, and the request is sent back into the cluster seamlessly to the other services.
This form of development allows you to build and test your microservices in a more integrated way with the rest of the application and the other microservices. All of this happens in the local development environment, even before your code is committed to source control. The Local Tunnel Debug capability also sidesteps operational complexities, such as having to build Docker images and deploying to a cluster to see the changes.
It also greatly simplifies microservice development by copying and applying the cluster’s environment to the native service running on your workstation. This eliminates the need to manually source, configure, and compile external microservice dependencies during development. Environmental variables, connection strings, and volumes from the cluster environment are inherited and available to the microservice running locally.
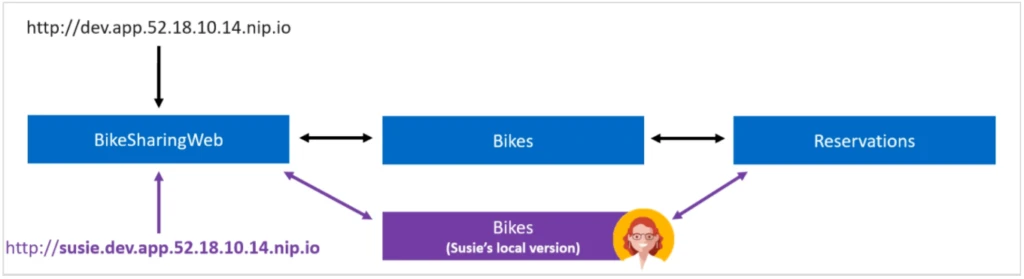
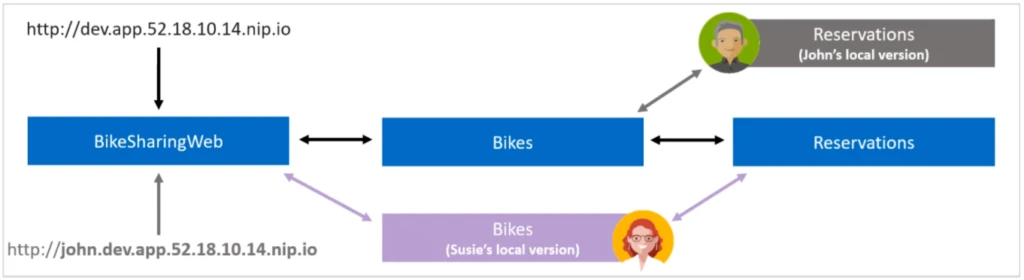
For development teams targeting a shared cluster, the local tunnel capability also offers a “work in isolation” mode. As an isolated service is created, you also get a specific URL to ensure that only traffic using that URL is redirected to your local workstation. All other requests, using the original application URL, are redirected to the unmodified service running in the cluster, so your development environment does not cause disruption to your teammates.
Whether you’re connecting to your development cluster running in the cloud, or to your local cluster, the Local Tunnel Debug capability is available for your end-to-end debugging scenarios.
Get started today
Learn how to use the Local Tunnel Debug capability by accessing our instructions.
Below is everything you need to get started with the Local Tunnel Debug capability.
- Get the Visual Studio Code extensions:
- Take a look at our documentation
Found an issue? Let us know on our GitHub repo.