
Power BI for Office 365: Making It Real
In my recent post, Simplifying Business Intelligence through Power BI for Office 365, I described how the Power BI cloud service has changed the way I personally work. The ability to do “self-service BI” without any IT involvement—and to have the infrastructure transparently provisioned in a cloud computing environment—has enabled me to drop any dependency on specific hardware, and I can use just about any Web browser. We have heard from many business users that this self-service approach is extremely empowering, and it enables rapid progress and insights.
One potential down side of self-service BI is that the reports, charts, and graphs that users develop with such tools can be cut off from other data and reports. Self-service BI solutions can also become out-of-date and are, as such, unreliable. These are serious limitations of self-service BI tools. For self-service tools to be convenient, as well as reliable and trustworthy, there needs to be a way to easily include user-created reports as part of a larger solution, and also to operationalize these solutions. Without such capabilities, self-service tools are, at best, good for prototyping.
Power BI is a complete system, tying together the empowering aspects of self-service with the operational and collaborative capabilities that are critical for an enterprise-class solution. Power BI also provides governance and data stewardship capabilities, as needed, to enable management oversight. The result is a managed self-service system.
In this post, I want to talk about how Power BI enables me to create complete business insight solutions that are based on fresh, reliable data. I will not cover data governance capabilities, keeping that as a topic for another day.
Pulling It Together
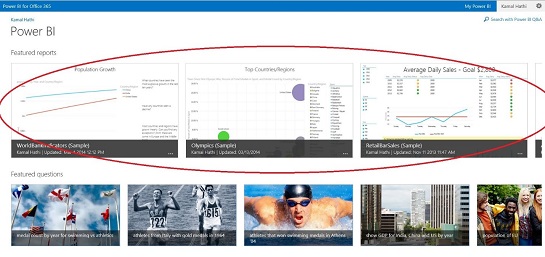
For me, a Power BI site is the place where I can pull together a full solution that gives an “at a glance” view of visualizations and insights that are available for a set—or sets—of data. It also is the place to enable operations such as refreshing the data for the solution. I use the “Featured Reports” row at the top of a Power BI sites application to highlight the reports and visualizations that may be most important and that I want to call out visually.
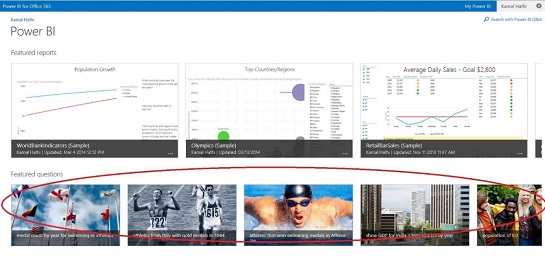
Power BI Q&A is a good way to ask ad-hoc questions using natural language, but to be really effective, it is important to provide starting points from which users can start exploring a dataset. For this, I use the “Featured Questions” capability. Featured questions enables me to come up with starter questions, which can be used in two ways:
1. To lead users into the Q&A experience from the Power BI site app main page through the Featured Questions row on Power BI sites.
2. To guide users to what they can ask on the Q&A page itself. The “About this data” slide out panel on the right side of the Q&A page lists several types of questions that users can ask.
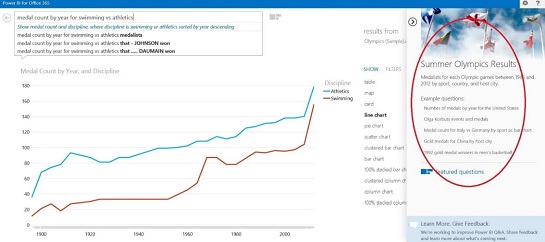
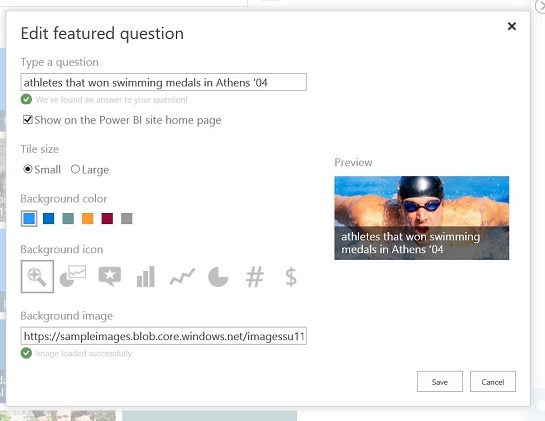
Adding specific featured questions can be done from the Featured Questions view (accessible from the  icon next to the Q&A text box and in the “About this data” slide out panel).
Keeping It Fresh
Power BI leverages Excel workbooks to create data models and compelling interactive visuals. Data is mashed up in Excel and can come from various different data sources. Typically, once I mash up data and have some interesting visuals to share, I upload the Excel workbook to a site on the Power BI service, and as simple as that, the solution is available in the cloud. So far so good, right—except that the data in the solution is “as of” the upload time. It can quickly get stale and might not make sense later, if the data is time-sensitive. Of course, it is possible to re-upload the workbook with refreshed data, but that is a manual and potentially unreliable solution. What is required is a way to automatically refresh the data. Power BI enables this via the “Scheduled Data Refresh” feature. Scheduled Data Refresh enables automatic updates on a regular schedule, keeping the data fresh and the reports reliable, and this is critical for real world solutions.
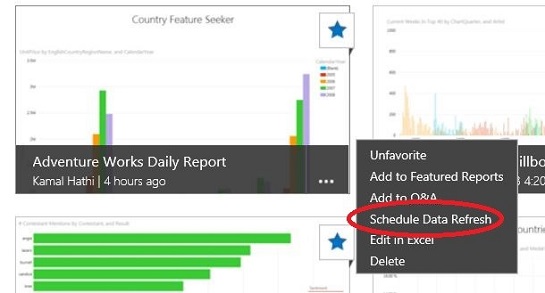
Like everything in Power BI, the process for setting up the Scheduled Data Refresh is self-service in nature. The ellipsis (…) menu for each workbook on the Power BI site is where a data refresh is configured and monitored.
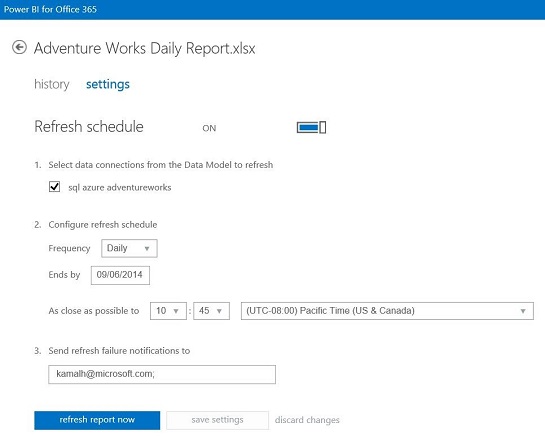
Setting up the actual schedule is straightforward, with simple options. Of course, the flip side to simplicity is that the options are somewhat limited. Over time, we will add more customizations, and the overall goal is to enable business users to set up the refresh without requiring help from someone in IT.
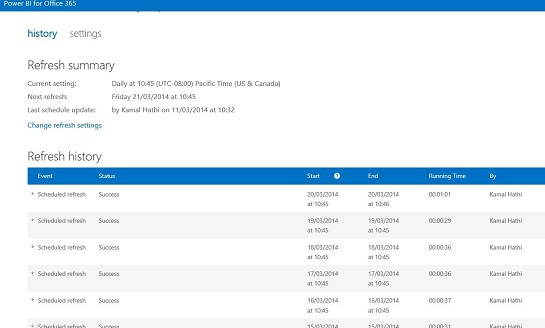
Once this is set up properly, the refresh job runs as defined in the schedule, and switching to the “history” tab provides a quick view of jobs that have already run and the results of each run (including any errors).
In the example, my data source is an Azure SQL Database, and as such, it is simple to establish the connection. The connection I defined in my Excel workbook just works in the cloud after uploading to the Power BI service, and the refresh operation also just works. However, in many cases, data comes from an on-premises source, and in these cases, the refresh is not as simple. To refresh data from an on-premises source, the first step is to install and configure the Data Gateway; then, add the data source to the Data Gateway. I will not cover this in detail here; it deserves a write up on its own.
A Complete BI System
With this up and running, the overall solution is now a workable and practical implementation. Power BI sites provide the “face” of the solution and allows the user to get productive quickly. The Scheduled Data Refresh ensures data freshness and reliability so critical to business insights. Power BI converts the Excel workbook from an island of data to a full participant in a BI solution, with fresh, reliable data that the business can rely on. Add this to the rest of the capabilities in Power BI related to data management, and we have a complete BI system that enables the business user to get powerful insights, and at the same time, still enables administrators to have a degree of oversight and control.
Read more about using the Power BI sites application with your SharePoint Online site.
Kamal Hathi, Director of PM, Data Platform Group
Check out the website to learn more about Power BI for Office 365 and start a free trial today. For those who want access to the upcoming SQL Server 2014 release as soon as possible, please sign-up to be notified once the release is available. Also, please join us on April 15 for the Accelerate Your Insights event to learn about our data platform strategy and how more customers are gaining significant value with SQL Server 2014. There also will be additional launch events worldwide so check with your local Microsoft representatives or your local PASS chapter for more information on SQL Server readiness opportunities.