
Driving Ground Breaking BI with APS
This blog post will detail how APS gives users the ability to:
- Leverage Power Query, Power Pivot, and Power Map at massive scale
- Iteratively query APS, adding BI on the fly
- Combine data seamlessly from PDW, HDI, and Azure using PolyBase
The Microsoft Analytics Platform System (APS) is a powerful scale out data warehouse solution for aggregating data across a variety of platforms. In Architecture of the Microsoft Analytics Platform System and PolyBase in APS – Yet another SQL over Hadoop solution?, the base architecture of the platform was defined. Here we’ll build on this knowledge to see how APS becomes a key element of your BI story at massive scale.
Let’s first start with a business case. Penelope is a data analyst at a US based restaurant chain with hundreds of locations across the world. She is looking to use the power of the Microsoft BI stack to get insight into the business – both in real time and aggregate form for the last quarter. With the integration of APS with Microsoft BI stack, she is able to extend her analysis beyond simple querying. Penelope is able to utilize the MOLAP data model in SQL Server Analysis Services (SSAS) as a front end to the massive querying capabilities of APS. Using the combined tools, she is able to:
- Quickly access data in stored aggregations that are compressed and optimized for analysis
- Easily update these aggregations based on structured and unstructured data sets
- Transparently access data through Excel’s front-end
Using Excel, Penelope has quick access to all of the aggregations she has stored in SSAS with analysis tools like Power Query, Power Pivot, and Power Map. Using Power Map, Penelope is able to plot the growth of restaurants across America, and sees that lagging sales in two regions, the West Coast and Mid-Atlantic, are affecting the company as a whole.
After Penelope discovers that sales are disproportionately low on the West Coast and in the Mid-Atlantic regions, she can use the speed of APS’ Massively Parallel Processor (MPP) architecture to iteratively query the database, create additional MOLAP cubes on the fly, and focus on issues driving down sales with speed and precision using Microsoft’s BI stack. By isolating the regions in question, Penelope sees that sales are predominantly being affected by two states – California and Connecticut. Drilling down further, she uses Power Chart and Power Pivot to breakdown sales by menu item in the two states, and sees that the items with low sales in those regions are completely different.
While querying relational data stored in APS can get to the root of an issue, by leveraging PolyBase it becomes simple to also take advantage of the world of unstructured data, bringing additional insight from sources such as sensors or social media sites. In this way Penelope is able to incorporate the text of tweets relating to menu items into her analysis. She can use PolyBase’s predicate pushdown ability to filter tweets by geographic region and mentions of the low selling items in those regions, honing her analysis. In this way, she is able to discover that there are two separate issues at play. In California she sees customers complaining about the lack of gluten free options at restaurants, and in Connecticut she sees that many diners find the food to be too spicy.
Iterative Analytics
So how did Penelope use the power of APS to pull in structured data such as Point of Sale (POS), inventory and ordering history, website traffic, and social sentiment into a cohesive, actionable model? By using a stack that combines the might of APS, with the low time to insight of Excel – let’s breakdown the major components:
- Microsoft Analytics Platform System (APS)
- Microsoft HDInsight
- Microsoft SQL Server Analysis Services (SSAS)
- Microsoft Excel with Power Query, Power Pivot and Power Map
Loading Data in APS and Hadoop
Any analytics team is able to quickly load data into APS from many relational data sources using SSIS. By synchronizing the data flow between their production inventory and POS systems, APS is able to accurately capture and store trillions of transactional rows from within the company. By leveraging the massive scale of APS (up to 6 PB of storage), Penelope doesn’t have to create the data aggregates up front. Instead she can define them later.
Concurrently, her team uses an HDInsight Hadoop cluster running in Microsoft Azure to aggregate all of the individual tweets and posts about the company alongside its menus, locations, public accounts, customer comments, and sentiment. By storing this data in HDInsight, the company is able to utilize the elastic scale of the Azure cloud, and continually update records with real-time sentiment from many social media sites. With PolyBase, Penelope is able to join transactional data with the external tables containing social sentiment data using standard TSQL constructs.
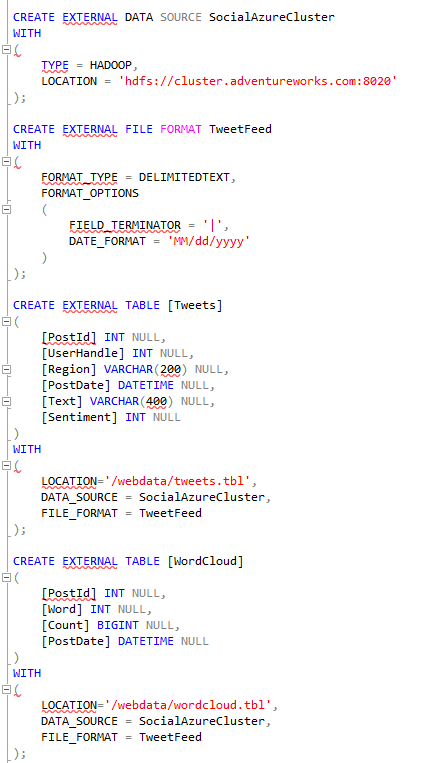
Creating the External Tables
Using the power of PolyBase, the development team can create external tables in APS connected to the HDInsight instance running in Azure. In two such tables, Tweets and WordCloud, Twitter data is easily collected and aggregated in HDFS. Here, the Tweets table is raw data with an additional sentiment value and the WordCloud table is an aggregate of all words used in posts about to the company.
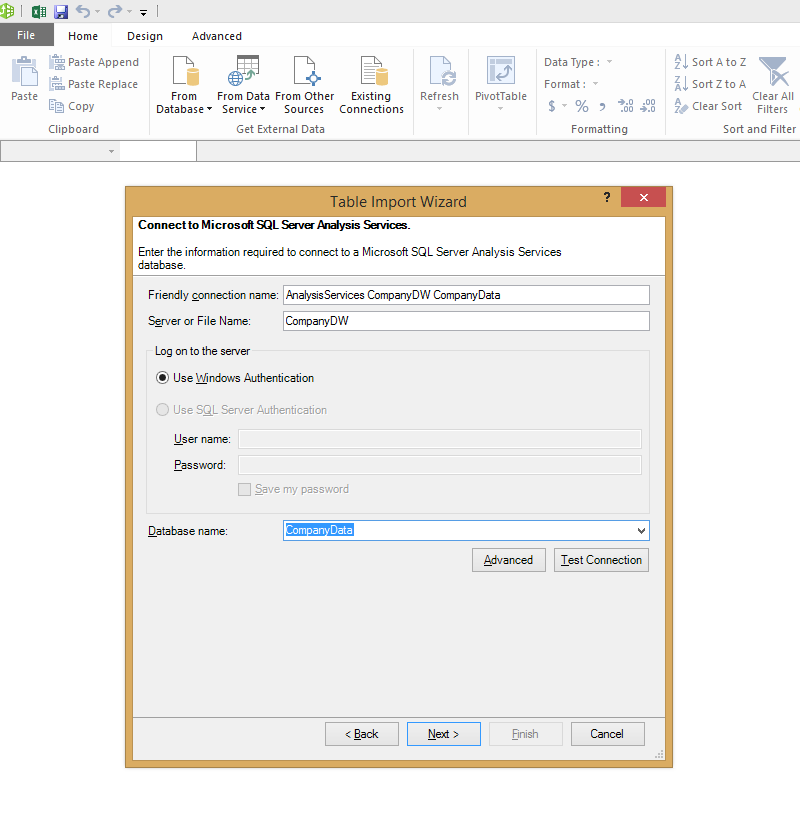
Connecting APS and SSAS to Excel
Within Excel, Penelope has the ability to choose how she would like to access the data. At first she uses the aggregations that are available to her via SSAS – typical sales aggregates like menu items purchases, inventory, etc. – through PowerQuery.
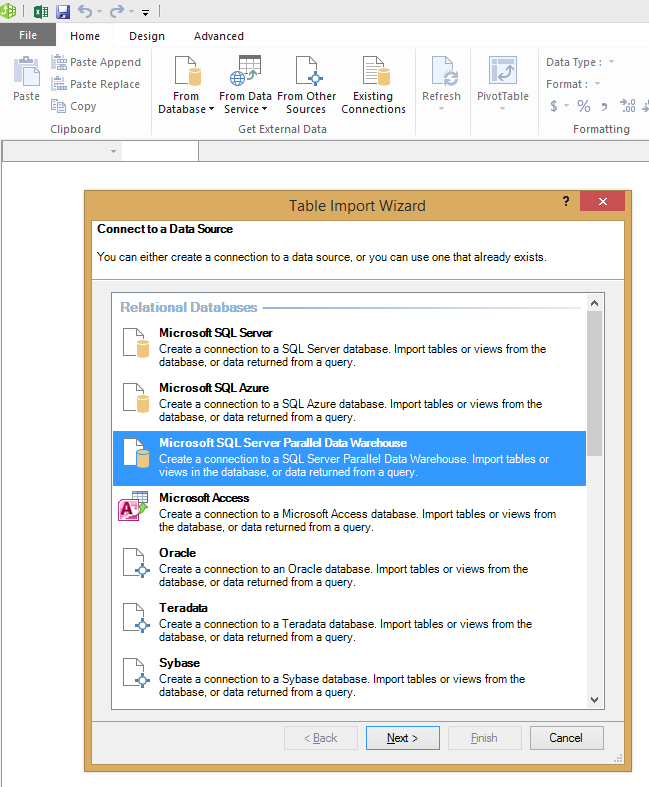
But how does Penelope access the social sentiment data directly from APS? Simple, by using the same data connection tab, Penelope can directly connect to APS and pull in the sentiment data using PolyBase.
Once the process is complete, tables pulled into Excel, as well as their relationships, are shown as data connections.
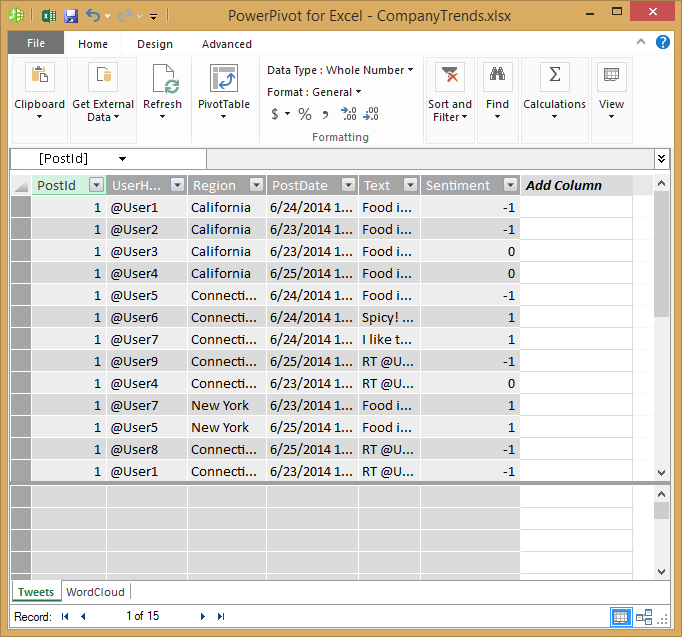
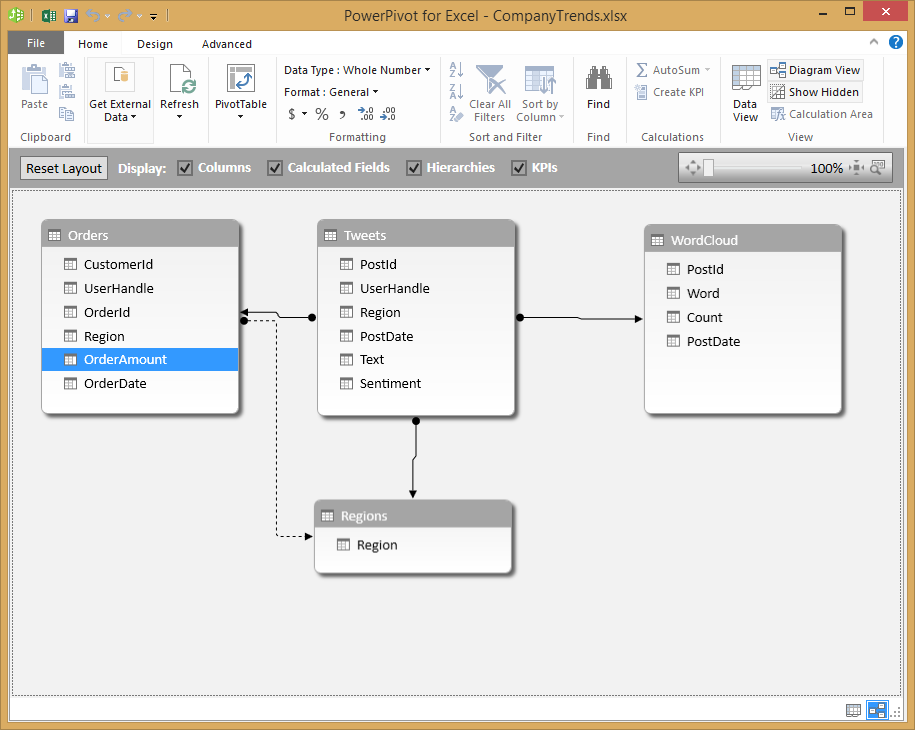
Once the data connection is created, Penelope is able to create a report using PowerPivot with structured data from the Orders table and the unstructured social sentiment data from HDInsight in Azure.
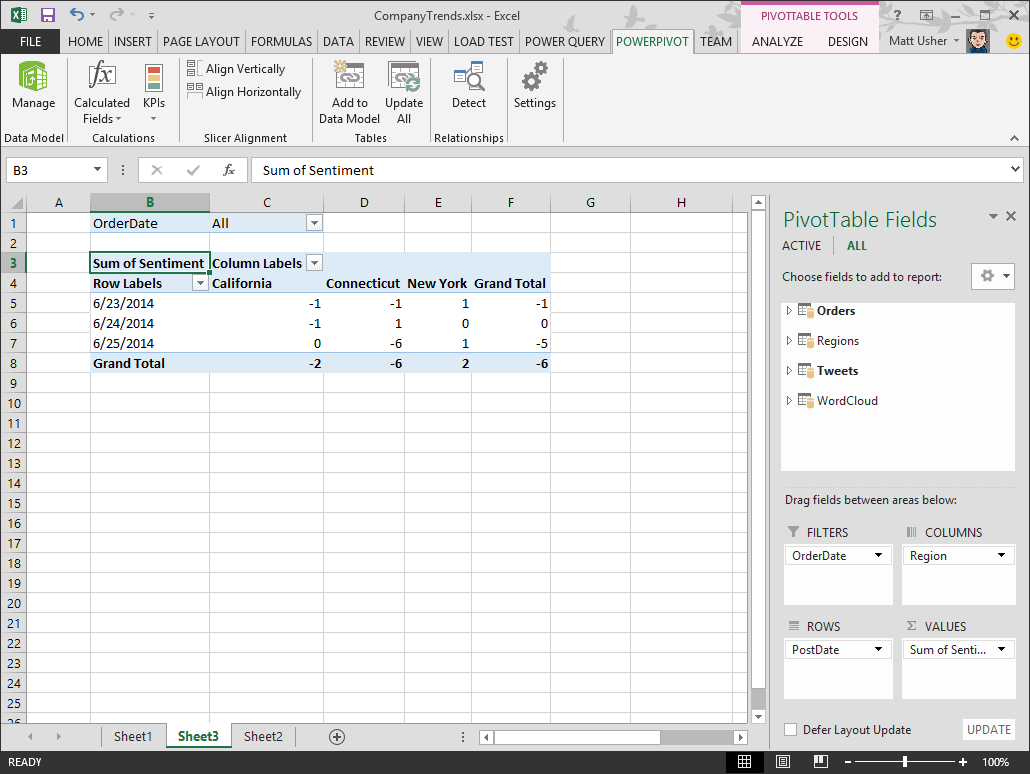
With both data sets combined in Excel, Penelope is able to then create a Power Map of the sales data layered with the social sentiment. By diving into the details, she can clearly see issues with sentiment from customers in Connecticut and California.
To learn more about APS, please visit http://www.microsoft.com/aps.
Drew DiPalma – Program Manager – Microsoft APS
Drew is a Program Manager working on Microsoft Analytics Platform System. His work on the team has covered many areas, including MPP architecture, analytics, and telemetry. Prior to starting with Microsoft, he studied Computer Science and Mathematics at Pomona College in Claremont, CA.