

How Hotpatching on Windows Server is changing the game for Xbox
In this article you’ll learn how Microsoft has been using Hotpatch with Windows Server 2022 Azure Edition to substantially reduce downtime for SQL Server databases running on…


Starting wit Windows Server 2008, we have published a server tuning guide each release designed to help system administrators and IT professionals get the best performance out of their server deployments. For Windows Server 2012 we published the Windows Server 2012 Tuning Guide, but this time there is a twist. This time we harnessed our performance knowledge from the tuning guide and embodied some of it as part of a newly redesigned Server Performance Advisor (SPA) tool.
SPA 3.0 helps IT administrators collect metrics to diagnose performance issues on Windows Server 2012, Windows Server 2008 R2, and Windows Server 2008 for up to 100 servers unobtrusively without adding software agents or reconfiguring production servers. It generates comprehensive performance reports as shown in figure 1 below and historical charts with recommendations.
In this post we discuss how SPA works and some of the unique features available at your fingertips once you download the tool.
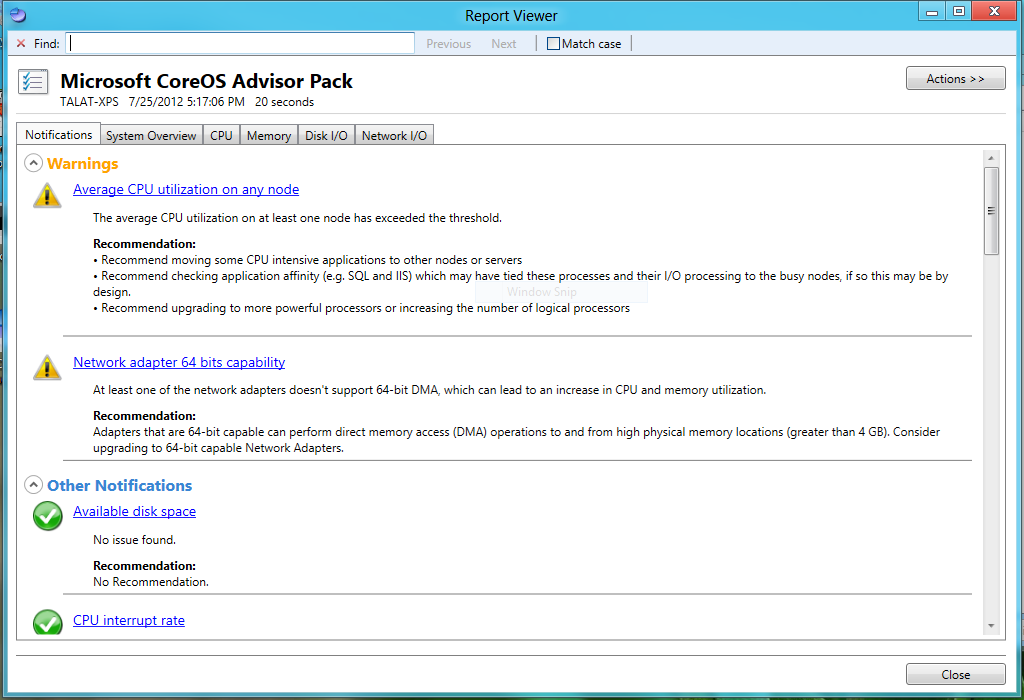
Figure 1: A snapshot of a SPA performance report with two warnings
At a high level, SPA is composed of two parts. The first is a management console or dashboard for the user to pick which servers they plan to collect data on, the corresponding role of the server, how long they need to collect data for, and how often collections happen. The console has a set of requirements listed on the download page.
The second part of SPA is the Advisor Packs or “APs”. APs contain a set of performance rules. An AP serves two purposes; first it defines what data gets collected from the server when that AP is instantiated. Second, the AP rules are used for assessing the server’s behavior. For example if data from a server shows more than 10% packet retransmit rate for any network adapter and that network adapter has a lot of send activity on it per system counters, then a warning is logged in a report.
Now let’s step back and give you a visual representation of the end to end process so you have a better understanding for the role each SPA component plays and how they interact with each another. The different steps in the flow are numbered 1 through 6 with each step described in greater detail below.
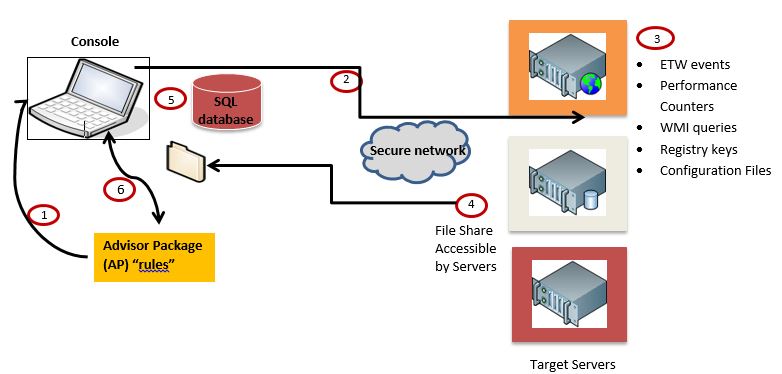
Figure 2: SPA workflow collecting data from remote servers
1. Setting up the data collection sessions
The user installed SPA and chooses which APs they want depending on the target server role. SPA ships with some built in APs like the Core OS AP, IIS AP, and the Hyper-V host AP. The Core OS AP is a generic AP covering the fundamentals like I/O and resource utilization, while the other 2 are role specific. The APs are imported into SPA to help define what data is collected and later used to assess the servers’ performance and generate the report. Users can choose and run multiple APs in a single data collection session.
2. Starting data collection on the target servers
The user defines how long they want to collect data for and chooses if they want a onetime collection or if they want to collect data at regular intervals. Keep in mind that the longer the collection the more data there will be to process and send back to the console machine. The console then sends a data collection request to the target servers over the Performance Logs and Alerts (PLA) service used by tools like Perfmon and SPA starts collecting the data.
3. Data collection on servers
Each target server receives a request from the console machine to start collecting a predefined set of data. SPA collects data from Event Tracing for Windows (ETW) events, Windows Management Infrastructure (WMI), performance counters, configuration files, and registry keys.
4. Saving the data for post processing
Each server writes the performance data to a pre-defined file share. We expect administrators to specify a file share on the console and avoid disk impact on the target server, but they can also choose where to create the file share from within SPA’s menu options.
5. Storing the data for generating a report
When the console pulls the data from the file share, it stores it in a SQL database. Because the data is stored in a database, SPA provides historical charts that help with trending performance behaviors over a period of days or hours. Users can also delete older reports from the database.
6. Generating the Performance report
SPA analyzes results based on the AP rules. It summarizes the findings in a report, identifies issues with some possible mitigation and lets the administrator decide if they want to make changes. NOTE: There is an expectation that this tool is used by experienced administrators that understand the intent of an implementation and are knowledgeable enough to determine whether a suggested mitigation is appropriate for the target system.
Now that you have an idea of how the process works end-to-end, let’s shift our focus to what users should come to expect from using SPA 3.0 in terms of installation, data collection, and report viewing.
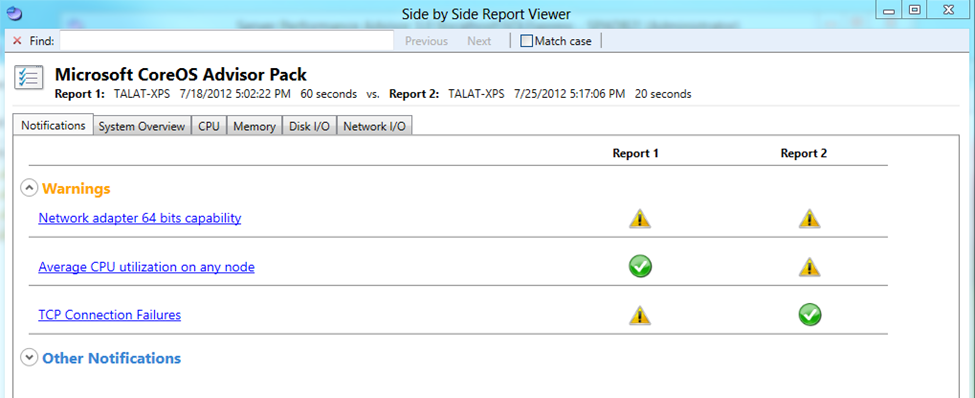
Figure 3: Side by side comparison report for the same machine at 2 different points in time
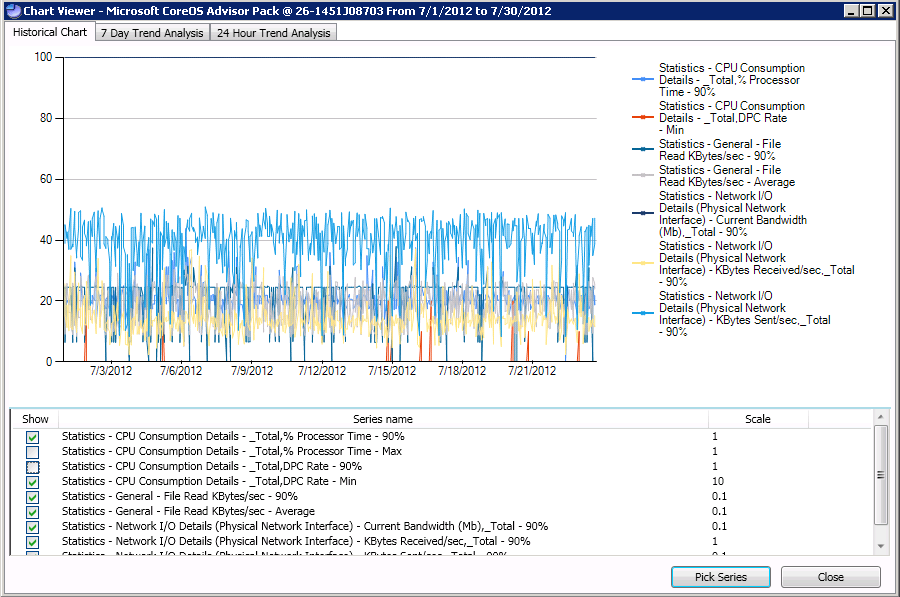
Figure 4: Historic trending chart showing performance metrics over time
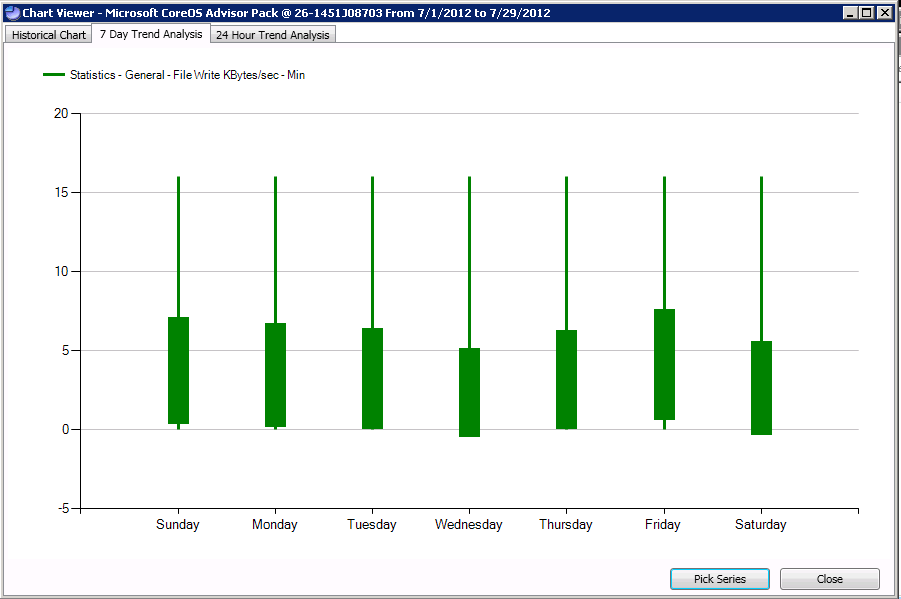
Figure 5: Trend for the minimum file write throughput achieved over a period of 7 days
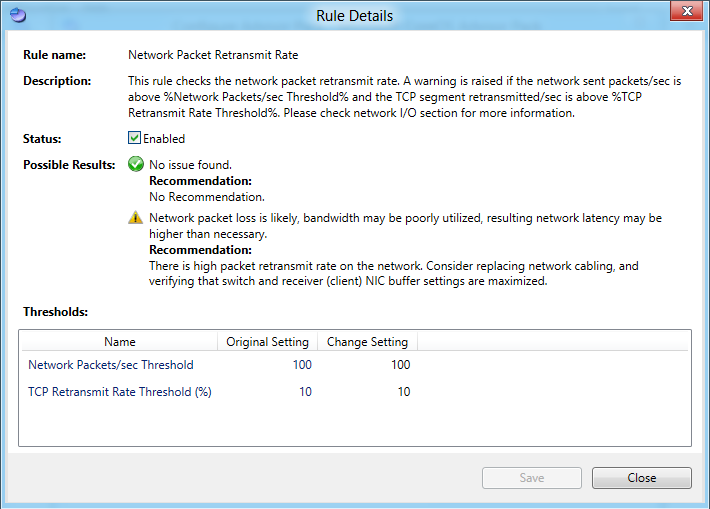
Figure 6: Users can get more information about a rule in the Details view
In this blog we introduced the redesigned Server Performance Advisor 3.0. We walked you through a high level overview of how the different SPA components interact and what role they each play. We also shared some of the exciting new features and capabilities available with SPA. We hope you enjoyed this post and we invite you to download and try out the latest bits from the SPA MSDN download page. Please share your experiences and send us feedback at spafb@microsoft.com.
In this article you’ll learn how Microsoft has been using Hotpatch with Windows Server 2022 Azure Edition to substantially reduce downtime for SQL Server databases running on…

This year, Microsoft Ignite 2023 took place in Seattle, Washington from November 12 to 15, 2023 and it was such a wonderful experience to meet and interact…

October 10th, 2023 marks the end of support date for Windows Server 2012/R2 and we want to outline options for customers to stay protected and compliant.