

Azure Sentinel – Dashboard queries
The vast majority of my day job at the moment includes Azure Sentinel. Some of the queries I’ve shown in the previous posts can be used to see data points for Sentinel as well.
Typically I display all these on an Azure Dashboard, but you can also just use the queries. Sentinel specifc DashBoards can be found here
My Example Dashboard
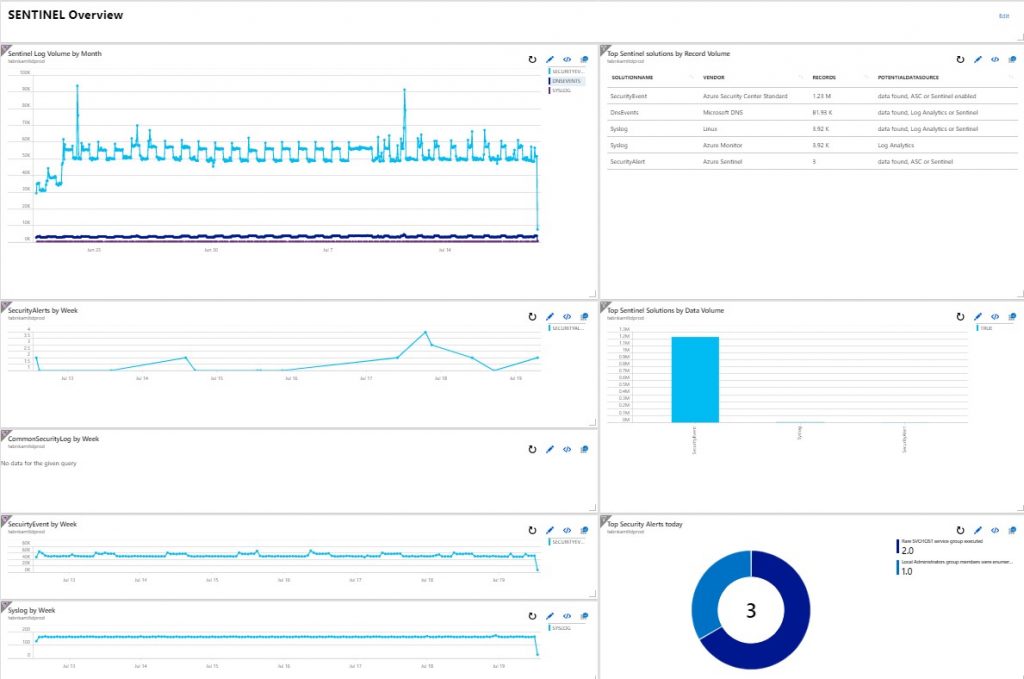
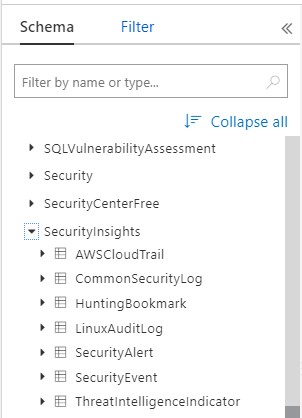
The new Data Tables that Sentinel uses are shown in this screen shot, but there are others that are related as well (you might want to include £Events ?)
The query top left in the first picture, uses a Union to pull in the various Tables (I use a bin interval of 1hr to speed up the query (returns less data), which is especially useful as I normally want to look at a week or monthly view).
let tBin = 1h;

union isfuzzy=true

(

// Firewall vendors

CommonSecurityLog

| summarize LogVolume=count() by bin(TimeGenerated,tBin), SolutionName = Type

),

(

// Office 365

OfficeActivity

| summarize LogVolume=count() by bin(TimeGenerated,tBin), SolutionName = Type

),

(

// Azure Security Center - free

SecurityCenterFree

| summarize LogVolume=count() by bin(TimeGenerated,tBin), SolutionName = Type

),

(

// Azure Security Center - Standard

SecurityEvent

| summarize LogVolume=count() by bin(TimeGenerated,tBin), SolutionName = Type

),

(

// Security Alerts

SecurityAlert

| summarize LogVolume=count() by bin(TimeGenerated,tBin), SolutionName = Type

),

(

// DNS

DnsEvents

| summarize LogVolume=count() by bin(TimeGenerated,tBin), SolutionName = Type

),

(

// Windows Firewall

WindowsFirewall

| summarize LogVolume=count() by bin(TimeGenerated,tBin), SolutionName = Type

),

(

// Azure AD

SigninLogs

| summarize LogVolume=count() by bin(TimeGenerated,tBin), SolutionName = Type

),

(

// Syslog

Syslog

| summarize LogVolume=count() by bin(TimeGenerated,tBin), SolutionName = Type

),

(

// AWS

AWSCloudTrail

| summarize LogVolume=count() by bin(TimeGenerated,tBin), SolutionName = Type

),

(

// Symantec

SymantecICDX_CL

| summarize LogVolume=count() by bin(TimeGenerated,tBin), SolutionName = Type

),

(

// Hunting Bookmarks

HuntingBookmark

| summarize LogVolume=count() by bin(TimeGenerated,tBin), SolutionName = Type

),

(

// ThreatIntelligence Indicator

ThreatIntelligenceIndicator

| summarize LogVolume=count() by bin(TimeGenerated,tBin), SolutionName = Type

),

(

// LinuxAuditLog

LinuxAuditLog

| summarize LogVolume=count() by bin(TimeGenerated,tBin), SolutionName = Type

)

| sort by LogVolume

| render timechart title ="Sentinel Log Volume by time"
Run the above here
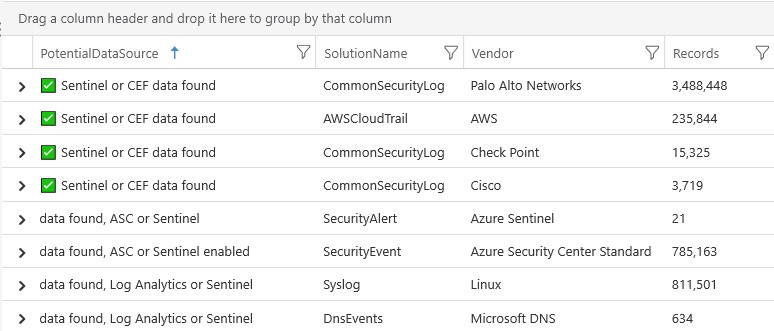
The second query (top right) is this one, in structure its very similar – but it’s giving an indication of the data we have and where it may be generated from. You can remove or add Tables that are relevant to you – I use this as a way to remember where the data was added Sentinel vs. Log Analytics.
union isfuzzy=true

(

// Firewall vendors

CommonSecurityLog

| summarize Records = count() by SolutionName = Type, Vendor = DeviceVendor

| sort by Records desc

| extend PotentialDataSource = iif(Records>0,"✅  Sentinel or CEF data found","no data")

),

(

// Office 365

OfficeActivity

| summarize Records = count() by SolutionName = Type, Vendor = "Microsoft O365"

| sort by Records desc

| extend PotentialDataSource = iif(Records>0,"data found, Log Analytics or Sentinel enabled","no data")

),

(

// Azure Security Center - free

SecurityCenterFree

| summarize Records = count() by SolutionName = Type, Vendor = "Azure Security Center Free"

| sort by Records desc

| extend PotentialDataSource = iif(Records>0,"data found, ASC or Sentinel enabled","no data")

),

(

// Azure Security Center - Standard

SecurityEvent

| summarize Records = count() by SolutionName = Type, Vendor = "Azure Security Center Standard"

| sort by Records desc

| extend PotentialDataSource = iif(Records>0,"data found, ASC or Sentinel enabled","no data")

),

(

// Security Alerts

SecurityAlert

| summarize Records = count() by SolutionName = Type, Vendor = "Azure Sentinel"

| sort by Records desc

| extend PotentialDataSource = iif(Records>0,"data found, ASC or Sentinel","no data")

),

(

// DNS

DnsEvents

| summarize Records = count() by SolutionName = Type, Vendor = "Microsoft DNS"

| sort by Records desc

| extend PotentialDataSource = iif(Records>0,"data found, Log Analytics or Sentinel","no data")

),

(

// Windows Firewall

WindowsFirewall

| summarize Records = count() by SolutionName = Type,  Vendor = "Microsoft Firewall"

| sort by Records desc

| extend PotentialDataSource = iif(Records>0,"data found, Log Analytics or Sentinel","no data")

),

(

// Azure AD

SigninLogs

| summarize Records = count() by SolutionName = Type,  Vendor = "Microsoft Azure AD"

| extend PotentialDataSource = iif(Records>0,"data found, Log Analytics or Sentinel","no data")

),

(

// Syslog

Syslog

| summarize Records = count() by SolutionName = Type, Vendor = "Linux"

| extend PotentialDataSource = iif(Records>0,"data found, Log Analytics or Sentinel","no data")

),

(

// Event log

Syslog

| summarize Records = count() by SolutionName = Type, Vendor = "Azure Monitor"

| extend PotentialDataSource = iif(Records>0,"Log Analytics","no data")

),

(

// AWS

AWSCloudTrail

| summarize Records = count() by SolutionName = Type, Vendor = "AWS"

| extend PotentialDataSource = iif(Records>0,"✅  Sentinel or CEF data found","no data")

),

(

// Symantec

SymantecICDX_CL

| summarize Records = count() by SolutionName = Type, Vendor = "Symantec"

| extend PotentialDataSource = iif(Records>0,"✅  Sentinel data found","no data")

),

(

// Hunting Bookmarks

HuntingBookmark

| summarize Records = count() by SolutionName = Type, Vendor = "Azure Sentinel"

| extend PotentialDataSource = iif(Records>0,"✅  Sentinel data found","no data")

),

(

// ThreatIntelligence Indicator

ThreatIntelligenceIndicator

| summarize Records = count() by SolutionName = Type , Vendor = "Azure Sentinel"

| extend PotentialDataSource = iif(Records>0,"✅  Sentinel data found","no data")

),

(

// LinuxAuditLog

LinuxAuditLog

| summarize Records = count() by SolutionName = Type , Vendor = "Azure Sentinel"

| extend PotentialDataSource = iif(Records>0,"✅  Sentinel data found","no data")

)

| sort by Records
Example output
The next Four Charts on the left are these. I like to run these with a time-span of a week to give me an insight into any spikes or dips per solution:
SecurityAlert

| summarize LogVolume=count() by bin(TimeGenerated,1h), SolutionName = Type
CommonSecurityLog

| summarize LogVolume=count() by bin(TimeGenerated,1h), SolutionName = Type

| render timechart title = "CommonSecurityLog by time"
SecurityEvent

| summarize LogVolume=count() by bin(TimeGenerated,1h), SolutionName = Type

| render timechart title = "SecurityEvent by time"
Syslog

| summarize LogVolume=count() by bin(TimeGenerated,1h), SolutionName = Type

| render timechart title = "Syslog by time"
The Bar Chart (2nd down on the right) is this query, which is similar to the cost ones here:
https://www.microsoft.com/en-gb/industry/blog/cross-industry/2019/07/18/azure-log-analytics-looking-at-data-and-costs-part-3/
Note: you could also write the first query in this post in this more compressed format (I didn’t mainly as I wanted to keep the comments and structure readable). However if you want the compressed version click here
union isfuzzy=true withsource = tt *

| where tt in ("Syslog", "SecurityEvent","AWSCloudTrail", "CommonSecurityLog",

"SecurityAlert", "ThreatIntelligenceIndicator", "LinuxAuditLog",

"HuntingBookmark")

| summarize

RecordCount = count(),

MbperRecord = round(count() / sum(_BilledSize/(1024*1024)),2) ,

TotalGBytes = round(sum(_BilledSize/(1024*1024*1024)),2)

by SolutionName = tt, _IsBillable

| sort by TotalGBytes desc

| render barchart
You can run the above here
The final Query (bottom right) is:
// Top 5 Security Alerts

SecurityAlert

| summarize count() by AlertName

| top 5 by AlertName desc

| render piechart