

Power BI Performance Tuning Workflow – Part 2

In Part 1 of the series, you learned how to ingest, transform, and load data, and how to develop and optimise the Power BI data model. This article provides guidance that enables developers to write optimised DAX expressions and design reports, as well as enabling administrators to deploy and manage Power BI solutions.
DAX Calculations
Variables vs Repeatable Measures
Let’s take a look at DAX Measures versus DAX with Variables:
DAX Measures

DAX with Variables
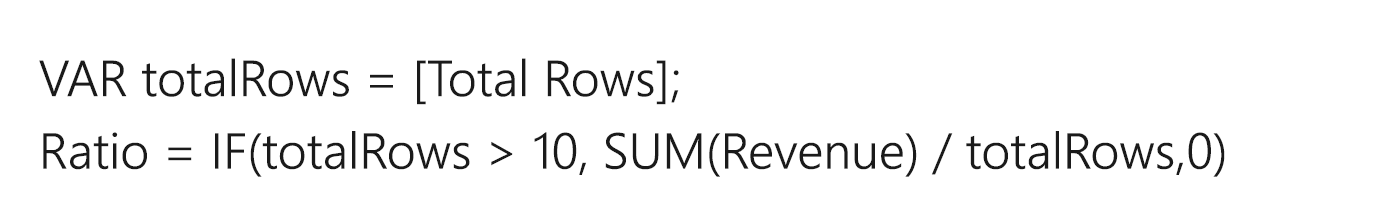
In the second scenario, the measure Total Rows in the first scenario is executed twice, whereas it is executed only once in the variables scenario. Under such scenarios, variables can improve performance significantly.
Handling Blanks
Sales (No Blank) =
IF (
    ISBLANK([Sales]),
    0,
    [Sales]
)
It’s recommended that measures return BLANK when a meaningful value cannot be returned, as this design allows Power BI to render reports faster. Also, returning BLANK is efficient because report visuals—by default—eliminate groupings when summarisations are set to BLANK.
SELECTEDVALUE () vs HASONEVALUE ()
A common scenario is to use HASONEVALUE() to check if there is only one value present in a column after applying slicers and filters, and then use the VALUES(column name) DAX function to get the single value.
SELECTEDVALUE () performs both the above steps internally and gets the value if there is only one distinct value present in that column, or returns blank in case there are multiple values available.
SELECTEDVALUE () vs VALUES ()
VALUES () will return an error if it encounters multiple values. Normally, users handle it using error functions which are bad for performance. Instead of using that, SELECTEDVALUE () must be used. It is a better approach and returns blank in case of multiple values being encountered.
DISTINCT () vs VALUES ()
Power BI adds a blank value to the column in case it finds a referential integrity violation. For direct queries, Power BI by default adds a blank value to the columns as it does not have a way to check for violations.
DISTINCT (): does not return blank when encountering an integrity violation. It returns blank only if it is in part of the original data.
VALUES (): includes blank, as it’s added by Power BI due to referential integrity violations.
The usage of either of the functions should be the same throughout the whole report. Use VALUES () in the whole report if possible so that blank values are not an issue.
Avoid FORMAT in measures
Format functions are done in a single-threaded formula engine and slows down the calculation for large numbers of string values.
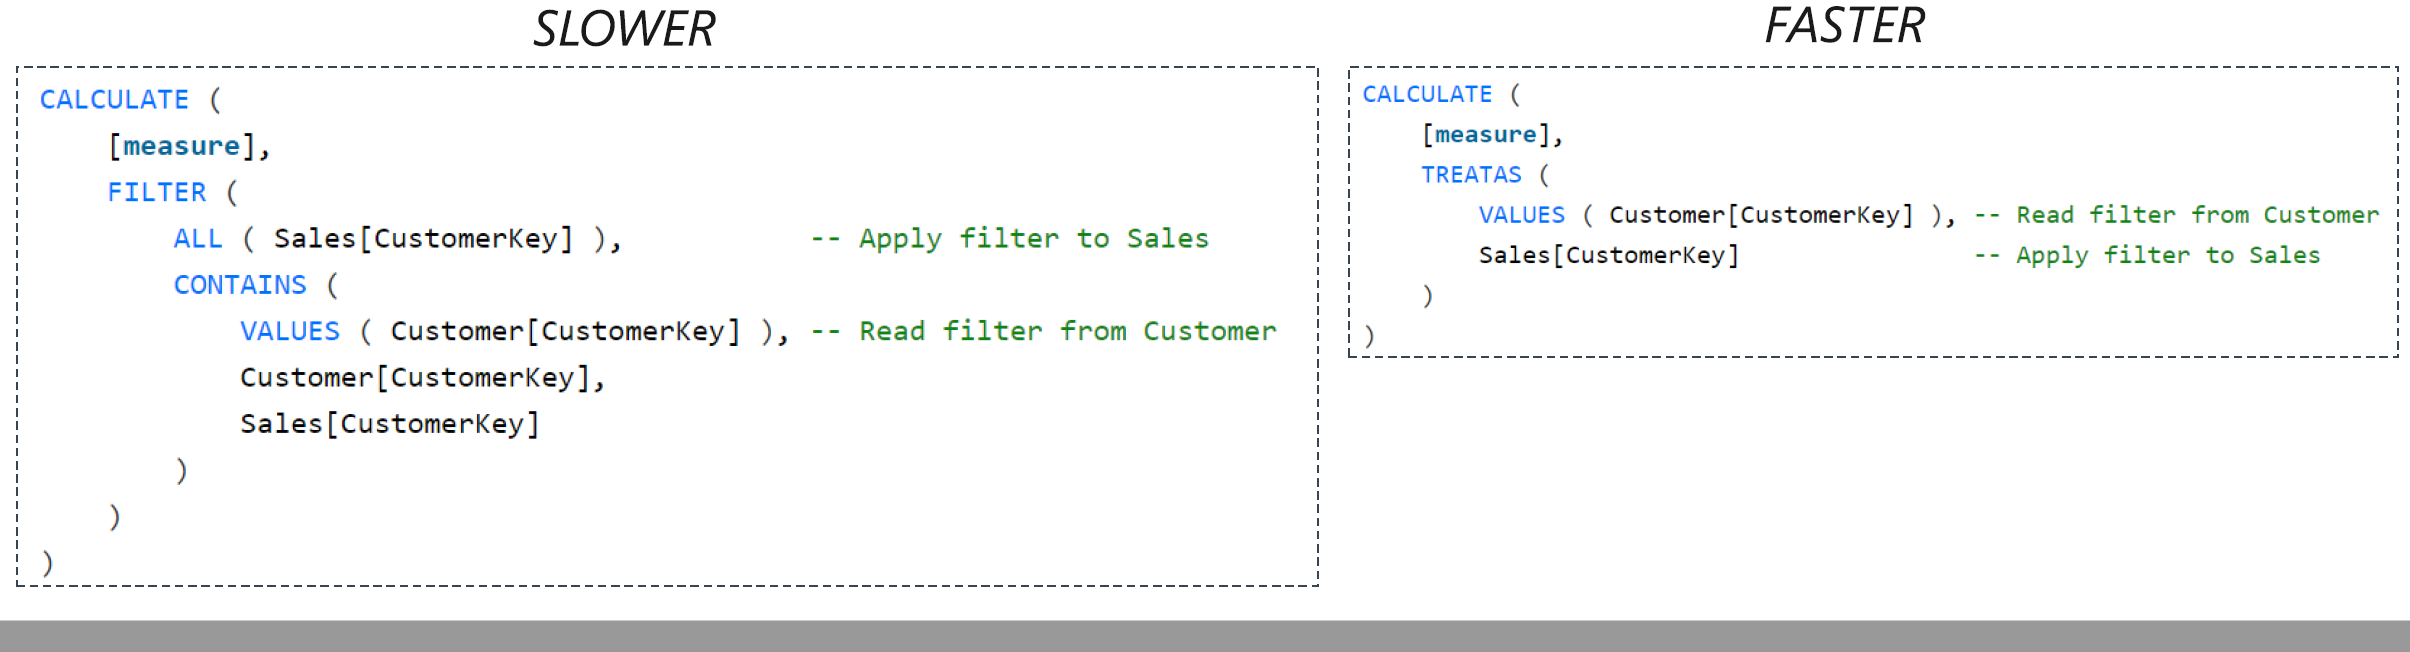
Optimize Virtual Relationships using TREATAS ()
A virtual relationship is simulated with DAX and column equivalency. FILTER|CONTAINS executes slower than TREATAS.
ISBLANK () vs Blank ()
The built-in function ISBLANK () to check for blank values is faster than using the comparison operator “= Blank ()”
Ratio Calculation efficiently
Use (a-b)/b with variables instead of (a/b)-1. The performance is the same in both cases usually, but under edge cases when both a and b are blank values, the former will return blanks and filter out the date whereas the latter will return -1 and increase the query space.
DIVIDE () vs /
DIVIDE () function has an extra parameter which is returned in cases where the denominator value is zero. For scenarios that might have a zero in the denominator, it is suggested to use DIVIDE () as it will internally check if the denominator is zero. It also checks for ISBLANK (). However, if there can be a guarantee that the denominator will be non-zero, it is better to use / because DIVIDE() will perform an additional if ( denominator <> 0 ) check.
Avoid IFERROR () and ISERROR ()
IFERROR () and ISERROR () are sometimes used in measure. These functions force the engine to perform a step by step execution of the row to check for errors. So wherever possible, replace with the in-built function for error checking.
Example: DIVIDE () and SELECTEDVALUE () perform an error check internally and return expected results.
COUNTROWS () vs COUNT ()
When the intention is to count table rows, it is recommended that you always use the COUNTROWS function. It’s more efficient and doesn’t consider BLANKs contained in any column of the table.
SUMMARIZE () Vs SUMMARIZECOLUMNS ()
SUMMARIZE is used to provide aggregated results by performing groups of actions on the columns. It is recommended to use the SUMMARIZECOLUMNS () function, which is the optimised version. SUMMARIZE should only be used to get just the grouped elements of a table without any measures/aggregations associated with it.
FILTER (all (ColumnName)) vs FILTER (VALUES ()) vs FILTER(Table)
Instead of applying a filter to the whole table, it is better to apply filters to a desired column. Also, use ALL with the FILTER function if there is no specific need to keep the current context. To calculate measures while ignoring all the filters applied on a column, use the All (ColumnName) function along with FILTER instead of Table or VALUES ().
Avoid AddColumns () in measure expression
By default, measure expressions are calculated in an iterative manner. Adding Addcolumns will convert it to a nested loop and further slow down the performance.
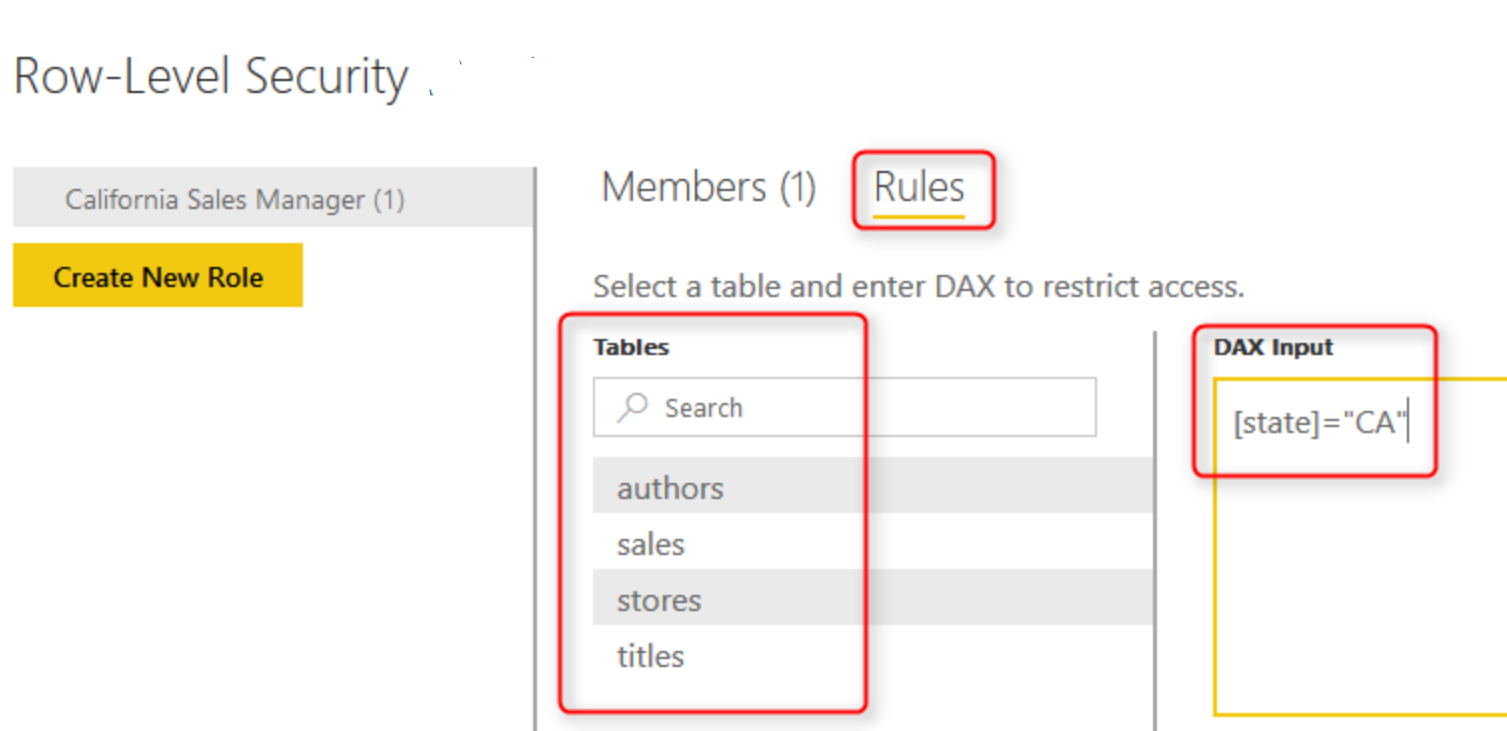
Complex Row Level Security
- Keep the security table as small as possible. If the security granularity needs to be applied, consider multiple security tables. It is recommended to have relationships between security tables, as this will avoid the additional LOOKUP calls for filter operations.
- Avoid Row level security filter directly on Fact tables.
- If you have multiple RLS filters applied on a single fact table, consider a mapping table, and implement all the RLS fields on the single table.
- Avoid Bi-directional filters, instead of converting to a single direction in combination of FILTER DAX expression.
- Keep filter functions simple and avoid regular expressions, string manipulation and complex logic.
Reports and dashboard design
Limit Number of Visuals
A good starting point is to build a report with few tiles, with a maximum limit of 20 visuals. Every visual generates at least one query against its data source, so a higher number of visuals can throttle the CPU and network.
- A suitable approach is to segregate high level KPI data and granular line item reports in separate reports.
- Drill Through to provide granular data.
- Set default slicer and filters to limit dataset context.
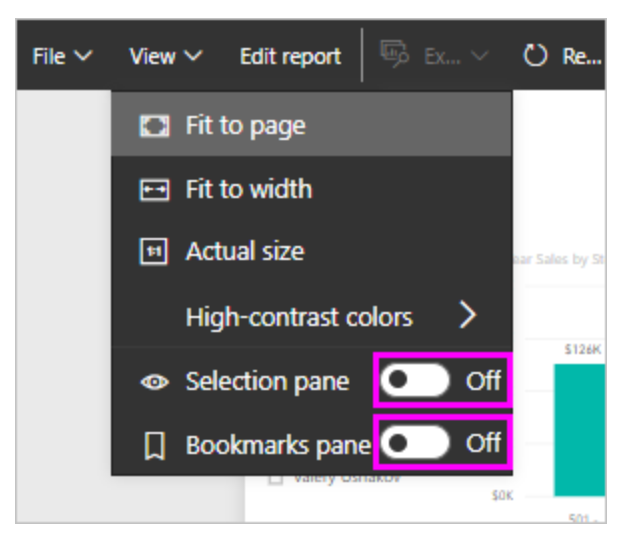
- Use the bookmark capability to hide visuals and provide subsets of data for analysis.
- Test custom visual performance in isolation. Replace custom visuals with built-in visuals wherever possible. However, if there is a functionality gap, it is recommended to use ones that are validated by Microsoft.
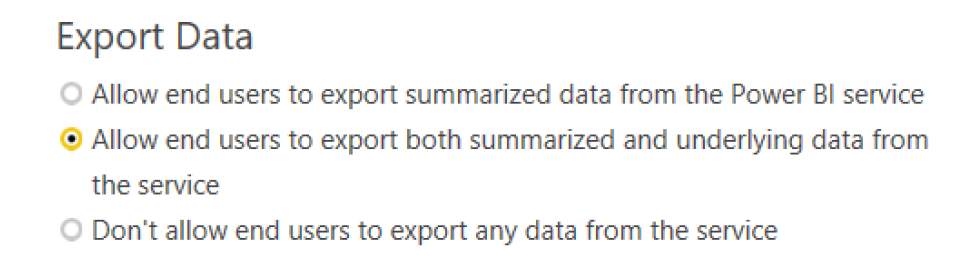
- Avoid the export of reports with large granular data. Leaf level queries will consume memory and network bandwidth. Limit data export by selecting either export summarised data or none.
Simplify Table or Matrix data
Tables/matrix in reports with thousands of rows, many columns and measures can be complex and slow. Also, so many rows can be overwhelming for users to gain good insights.
- Use TopN filters to limit the initial view of table.
- Move less critical measures to tooltips so these are only displayed on demand, per row.
Slicers/Filters
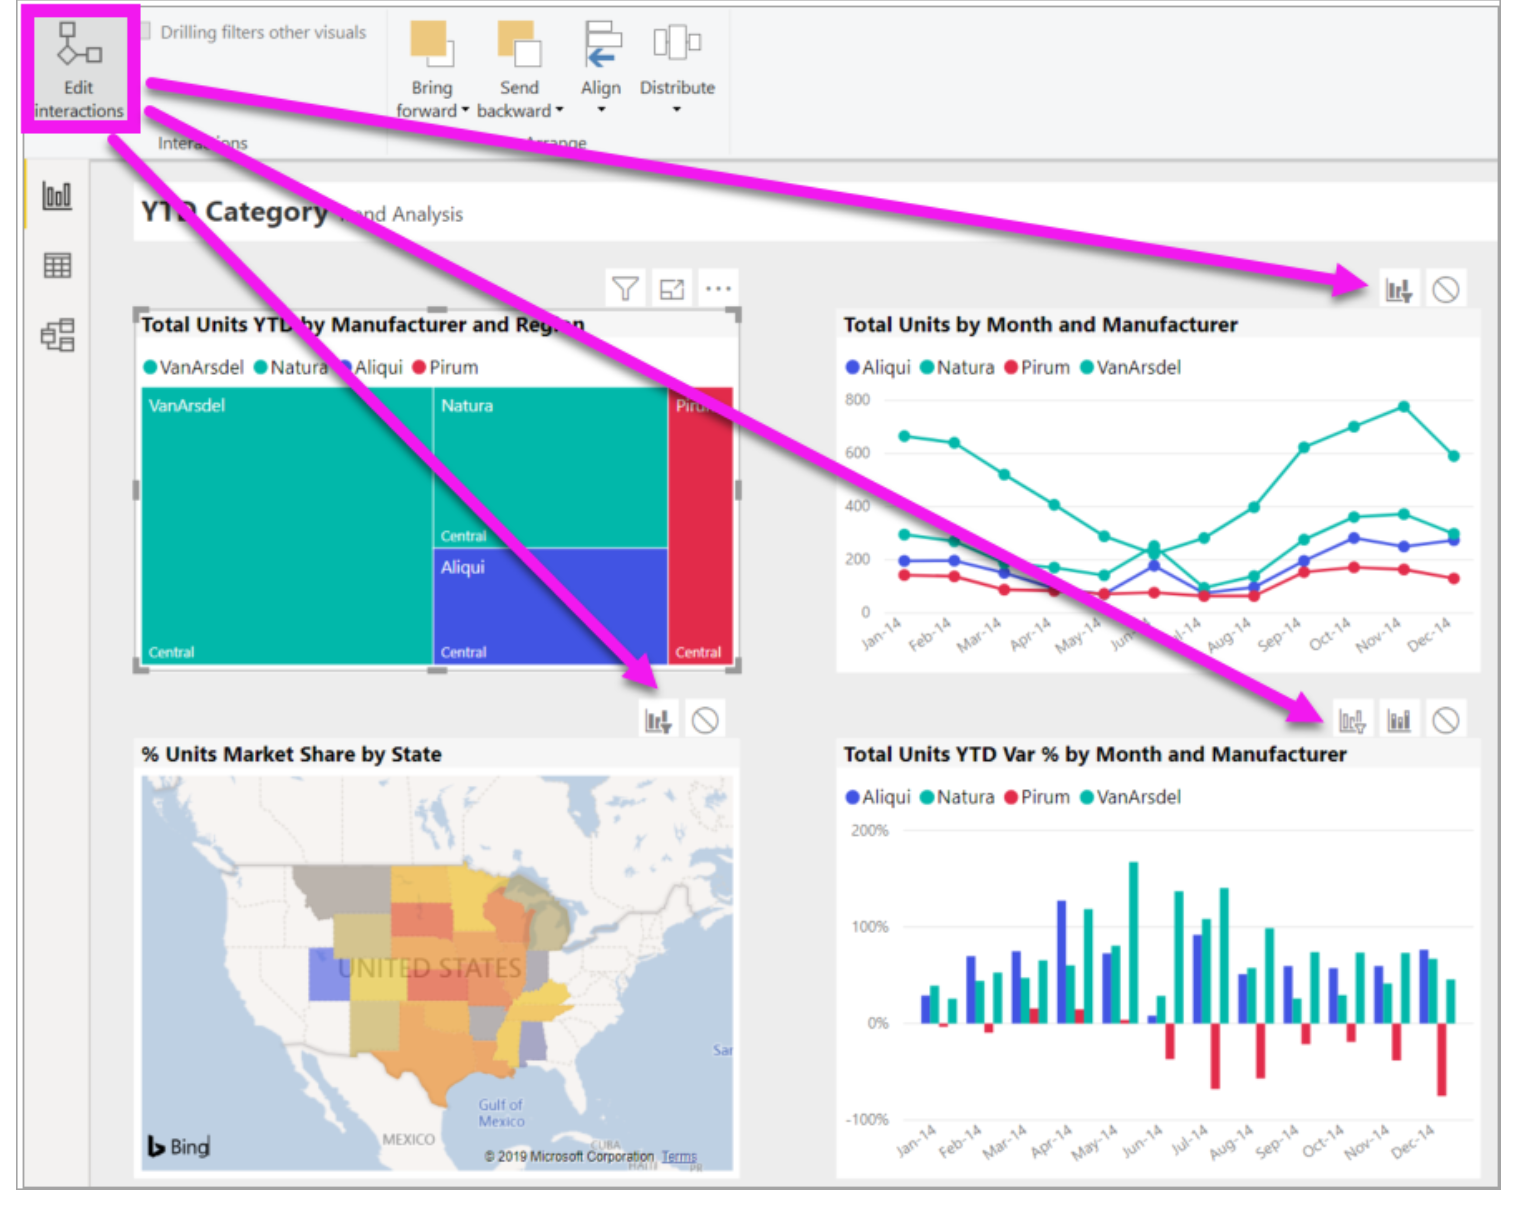
- With a high number of visuals, using slicers or cross filters for every other visual by default generates many queries. An option is to edit interactions and disable the meaningless cross filters.
- Avoid slicers with a very large number of values. Slicers have two queries; One is to populate and the other is to fetch selection details. Instead of slicers, use filters or force context and limit values.
- Also, set default values and set single/multi-select properties in slicers. It will reduce the context, reduce memory load, and fetch less data.
- Use sync slicers with care.
Data Source/Network Latency
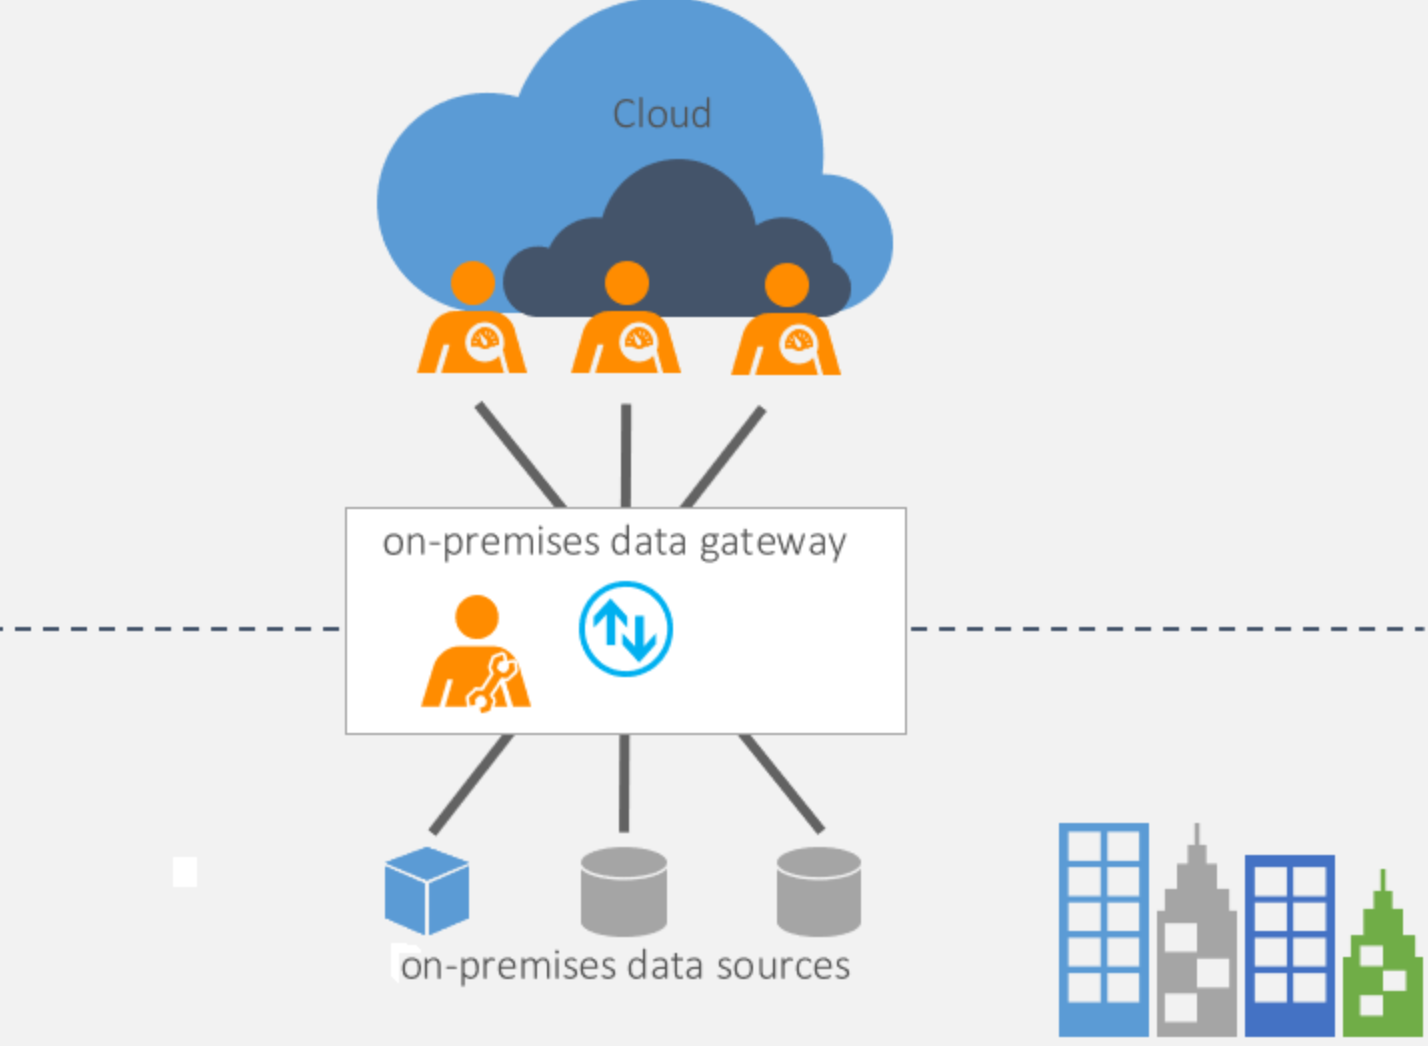
The on-premises data gateway (OPDG) acts as a link to provide secure data transfers between on-premises data and Azure data services. One of the cloud services in Power BI uses OPDG to connect to data sources that are connected to data sources on-premises, or those within a private vnet.
Data Gateway Configuration
- Keep data gateways as close to the data source. The data traffic between the gateway and Azure is compressed, as this will minimise the raw data movement for shorter distances between data source and gateway, and leverage the benefit of the compression in the downstream traffic.
- Use enterprise gateways instead of personal gateways because enterprise gateways enable centralised gateways and data source management and supports various storage models.
Gateway Parallelism
The on-premises data gateway has settings controlling the resource usage on the machine where the gateway is installed. By default, gateways automatically scale these values, using resources depending on CPU usage. In scenarios related to poor refresh, there are a few settings that can be considered
- MashupDefaultPoolContainerMaxCount: Maximum container count for Power BI refresh, Azure Analysis Services, and others.
- MashupDQPoolContainerMaxCount: Maximum container count for Power BI Direct Query. You can set to twice of number of cores in gateway or leave it to auto tuning
Read more on how to adjust gateway performance based on server CPU on Microsoft Docs.
AutoScaling Gateway
Currently the gateway application utilises resources on the gateway machine based on the pre-configured state. The autoscaling application can now scale to use more or less resources depending on the system CPU.
To allow the gateway to scale based on CPU, this configuration “MashupDisableContainerAutoConfig” would need to be set to false. When this is done, the following configurations are adjusted based on the gateway CPU.
Read more about this on the Power BI blog.
Cluster Load Balancing
- Gateway admins can throttle resources of each gateway member to make sure either a gateway member or the entire gateway cluster isn’t overloaded causing system failures.
- If a gateway cluster with load balancing enabled receives a request from one of the cloud services, it will randomly select a gateway member. If the chosen member is already near the throttling limit set for CPU or memory, another member within the cluster is selected. If all members within the cluster are in the same state, all the new requests fail.
- CPUUtilizationPercentageThreshold – This configuration allows gateway admins to set a throttling limit for CPU. The range for this configuration is between 0 to 100. The default value is 0, would indicate that this configuration is disabled.
- MemoryUtilizationPercentageThreshold –Allows gateway admins to set a throttling limit for memory with a between 0 to 100.The default value is 0, would indicate that this configuration is disabled.
- ResourceUtilizationAggregateionPeriodInMinutes –The time for which CPU and memory system counters of the gateway machine would be aggregated to be compared against the respective threshold limits using above mentioned configurations. The default value is 5.
Use SSD/Fast Storage
Power BI gateway refresh and data movement returns a large dataset that is temporarily stored on the gateway machine. It is recommended to have SSD storage for the spooling layer.