

How the University of Tennessee built a strong data foundation
| Focus on: Optimize Operations, Empower Employees |
Late on a Monday afternoon, the audit and compliance department at the University of Tennessee anxiously awaits the data they need. When it comes through, they must view it in slices, trying to piece together a story to share with stakeholders.
The University of Tennessee has five campuses and two institutes, each using their own individual platforms and analytics tools. The efforts were less than stellar—if you ask seven different people to draw a dog, what are the odds that you’ll get seven Beagles? The university needed one platform that would serve as a foundation for cutting-edge technologies to come—one that would improve processes, communication, and collaboration with stakeholders, partners, and students now and well into the future.

With the new platform in place, the audit and compliance department receives a dozen updates throughout the day. Rather than having to deduce results from various puzzle pieces, they compile data from across all of the university’s systems and campuses and verify it in seconds. That means the team can easily share a visual story with stakeholders that will help them make more strategic decisions in real time.
This is a real story of digital transformation.Optimizing operations for streamlined researchInvestment in its data platform is relatively new for the UT system. The traditionally siloed databases used to be sprawled across each of the seven campuses. In 2011, the university began researching the potential of a unified BI system that would connect every campus and institution across all information systems. The UT System Administration recognized the importance of being able to make strategic decisions and set out to determine their data needs.
For much of the next four years, there were scattered efforts in terms of analytics – and even a few sparks – but nothing cohesive. After some progress, including an envisioning session at a Microsoft Technology Center (MTC), and more than a few setbacks, Dr. Jay Eckles was appointed as Director of Business Intelligence. On day two of his job, together with Dr. Dennis Hengstler, Assistant VP of Institutional Research, he began facilitating the process of developing a new strategy. Dr. Eckles and his colleagues created a three-pronged approach that included a:
· Consolidated repository
· Report verification process
· Data access and stewardship process
These goals became the tenets of their data strategy.

The University’s leadership had seen time, money, and personnel burn through previous failures. They were in need of a solution that required low capital investment and would use fewer resources. Because the university was already using Office 365 and Power BI integrated seamlessly into their existing investment, SQL Server provided a single vendor solution for each level of their integrated stack. Power BI’s data visualization tools were not only easy to use and visually appealing, but they also offered a majority of the available features at a fraction of the cost of competitors.
“One of the things that SQL Server and PowerBI allow us to do is bring together data across the university’s systems and campuses, and begin to answer questions we simply didn’t have the tools to answer before,” Dr. Eckles explains.
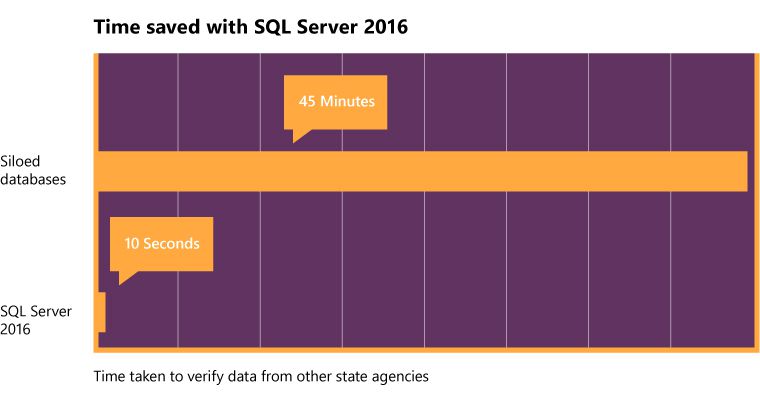
Instead of sending data and reports back and forth with other state agencies, the university can now share verified information incredibly quickly. And even more impressive is that the time it takes to verify that data has decreased an astounding 99%. Where it used to take about 45 minutes to verify data, it now takes just 10 seconds using SQL Server 2016 technologies.
In the past, audit and compliance information was delivered once a day, at the end of each day. SQL Server has made it possible to deliver responses within 15 minutes, which means they receive a dozen or more updates a day.
“The reporting tool used for the self-assessment of controls provided us with the results we needed and allowed us to access the data in a way we had not been able to previously,” says Judy Burns from the audit and compliance team.Empowering faculty and staff to do more with less“The goal of the UT system’s BI initiative was to develop a platform that would offer timely, accurate, consistent, and historically relevant data to users across the state,” explains Kriss Gabourel from UT’s institutional research department. “In the past, we were only able to look at data one ‘slice’ at a time, making it difficult to collect meaningful trend data. Now we are able to easily view data over time and can quickly spot trends and perform complex analysis. It’s nice to be able to provide accurate and reliable information quickly to those who need it.”
With 10,000 employees in its system, there was a great deal of overlap in the research being conducted at different locations. With the unified Microsoft solution, researchers could now much more easily find each other across campuses. Consolidating student data for enrollment modeling allowed for more strategic planning, and engaging external partners became easier as well. A partnership with the Education Advisory Board helped one campus understand how resources produce results for the students in those programs, something that would have been difficult to tackle in the past, simply because the data for that analysis wasn’t available.
Now, that data is making a difference at the university and throughout the state. With SQL Server and Power BI, the university’s government relations department has been able to create a visually appealing and easy to understand map of the state , showing exactly how many higher education students are in each district, and provide other data that matters to legislatures.
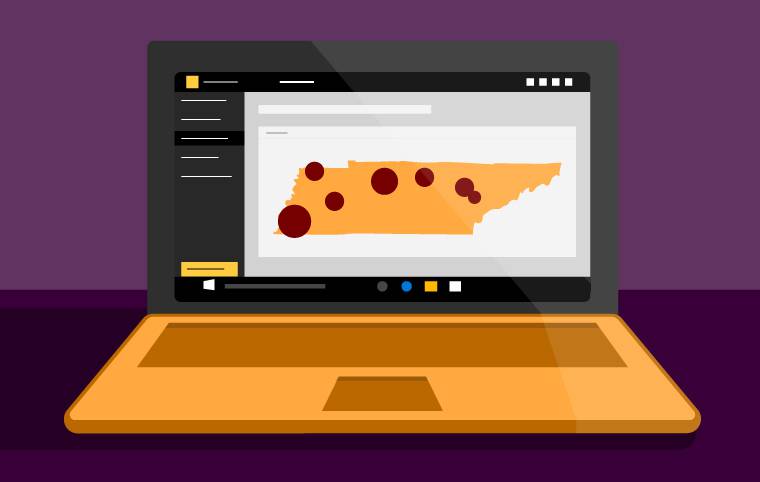
Click on the image above to explore a live dashboard showing University of Tennessee student enrollment by district.
“Public higher education in Tennessee is funded on a performance level, so the numbers really matter,” explains Dr. Eckles. “Institutions must be confident in the numbers submitted to the state. SQL Server and Power BI put leadership at ease.”
The University of Tennessee is a 1.2 billion dollar enterprise. Despite their size, they are able to support centralized BI with a staff of just six. That’s largely because finding help with Microsoft tech is so easy. The team is familiar with the tools, so the learning curve was much less, the tools were easy to administer, and fewer resources were necessary.Looking to the futureThe University of Tennessee anticipates offering a more public approach to analytics. They are in the process of completing their first public-facing Power BI reports and are working on building out others and figuring out how best to roll them out. The old method of communicating those metrics was static, but Power BI dashboards allow the public to manipulate the reports to get the information important to them.
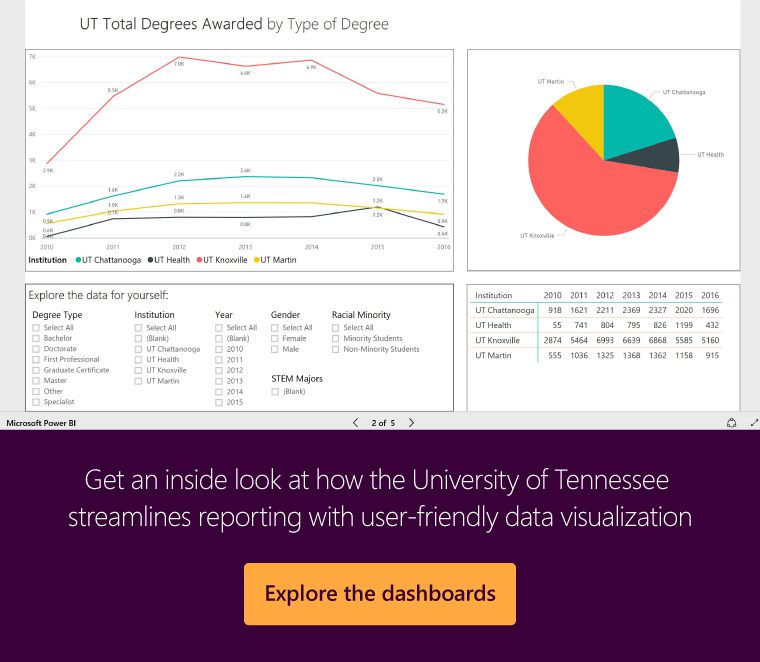
Click on the dashboard above to view more sample interactive dashboards from the University of Tennessee
Dr. Eckles advises others in his position who are considering beginning or improving their business intelligence to consider the tools already in their portfolio, and realize the value in using those with a familiar interface. Technology is moving at break-neck speed; machine learning, AI, and IoT are all taking center stage. But Dr. Eckles cautions that before universities make these high-tech tools available to decision makers, there must be a firm foundation, and a strong understanding of the fundamentals:“Once we can answer the questions, and have a firm foundation in place, then we’ll be in a position to take advantage of advanced analytics and other technologies.”
Microsoft is proud to partner with Dr. Eckles and the University of Tennessee to build a solid foundation for their digital transformation journey.
Related Content
- Read more Real Stories of Digital Transformation
- How to use data to improve student outcomes webcast
- The DIY Guide to a Modern IT Environment for Education
- Transforming education with technology webcast series