
SandDance, the beloved data visualization tool from Microsoft Research, has been re-released as an open source project on GitHub. This new version of SandDance has been re-written from the ground up as an embeddable component that works with modern JavaScript toolchains.
The release is comprised of several components that work in native JavaScript or React apps, in addition to using various open source libraries. We hope that with this new architecture, SandDance will be vastly more extensible, enabling new chart types, layers, and interactions, as well as being incorporated into new, vertical applications.
In addition to the raw JavaScript components, SandDance is available as an extension to both Visual Studio Code and Azure Data Studio and has also been re-released as a Power BI Custom Visual. We hope to see other innovative uses of SandDance embedded within many other applications where unit-based data visualization makes sense, such as in machine learning tools. We believe that making it an open source component is the first step towards that goal.
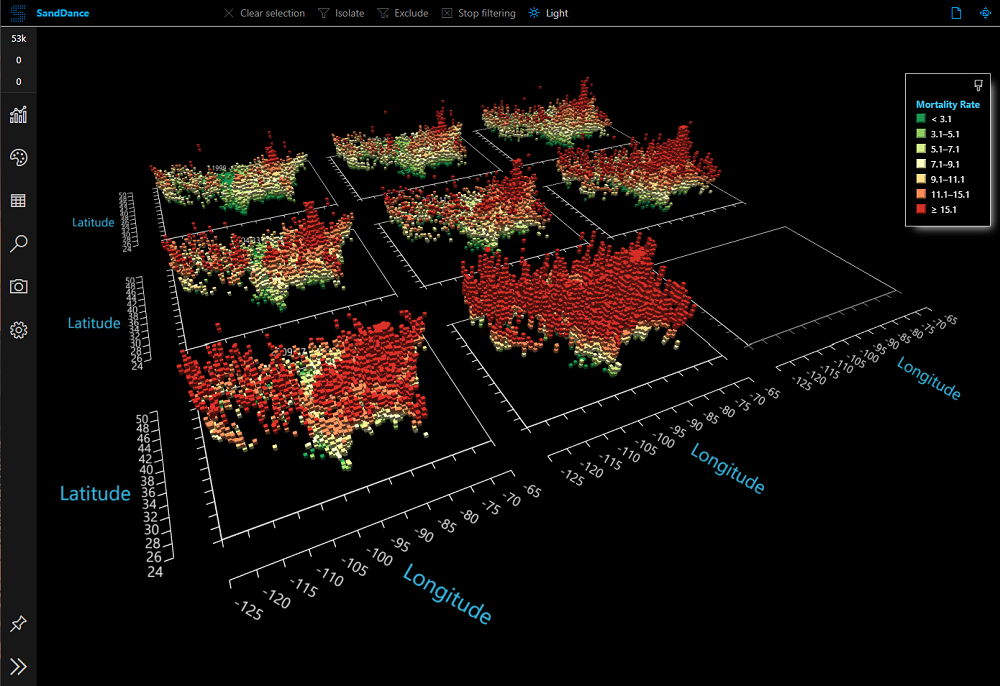
For those unfamiliar with SandDance, it was introduced nearly four years ago as a system for exploring and presenting data using “unit visualizations.” Instead of aggregating data and showing the resulting sums as bar charts, SandDance shows every single row of a dataset (for datasets up to ~500K rows). It represents each of these rows as a mark that can be colored and organized into different areas on the screen. Thus, bar charts are made of their constituent units, stacked, or sorted.
Different visualizations and layouts are all related to each other so that the units are animated from one position to another. This makes for compelling explanations through following a story using different representations to help show both an insight and how it fits within the context of the rest of the data.
SandDance provides 2D and 3D visualizations, bar charts, scatter plots, stacked charts, density plots, as well as interactive filtering and faceting of the data. It’s been showcased in recent PowerBI Summit and CEO Summit keynotes and has been downloaded by more than 300K people to date.
SandDance was created by Microsoft Research’s Visualization and Interactive Data Analysis (VIDA) group, which focuses on a human-centric approach to working with data, exploring areas such as data visualization, immersive analytics, and understanding of machine learning models. You can learn more about their work here.
Learn more about the new SandDance project on GitHub or our companion website. Here, you can try SandDance on any local dataset (nothing gets uploaded to the server), as well as instructions for building local versions or incorporating it into your own projects.
Other questions or feedback? Let us know in the comments below.