Power Automate Process Mining empowers warehouses to boost their efficiency significantly
Introduction
Every warehouse manager is keen on improving the processes on the warehouse floor. But where to start? What to optimize? It is far from easy to discover the bottlenecks. This is where the Power Automate Process Mining comes really handy. In the 10.0.35 release we ship the integration of Supply Chain Management Warehouse module with Power Automate Process Mining. This integration gives some really valuable insight into the material movement in the warehouse.
What is Power Automate Process Mining?
Power Automate Process Mining is a tool which exists exactly to help you gain insights, find bottlenecks and continuously improve business processes. It offers rich visualizations and deep analytics so one can get clear insights into the data.
There is an online version of it – part of the Power Automate offering. Using Power Query Online one can load data about the processes from various sources – starting from the Excel file, SQL databases and even calling custom APIs. Users can also connect to the already prepared data in Azure Data Lake and utilize powerful tools like Azure Data Factory for data preparation. The online version offers a customizable Power BI report with detailed process insights. However, one can download a desktop application which allows to perform deep process analysis. The desktop version reuses the same backend – same data and process definition – as an online version.
When working with Power Automate Process Mining you have to know some terminology – cases and activities. In the context of the warehouse material movement process analysis, Case is a closed warehouse work and Activity is a single work line (pick or put). Thus, a single case consists of activities – each of them is a “visit” to a certain location in the warehouse.
How to analyze material movement process in the warehouse using the Power Automate Process Mining?
In the 10.0.35 release we ship the integration of Supply Chain Management Warehouse module with the Power Automate Process Mining. It allows you to:
- Easily load warehouse material movement data into the Power Automate Process Mining. Users can choose how much data to load and so forth.
- The resulting Power Automate Process Mining Power BI report is integrated right into Supply Chain Management. Users can gain process insights without leaving Supply Chain Management – similar to embedded Power Bi reports experience.
In order to get insights, the user should first upload the data to Power Automate Process Mining. Our integration allows to achieve that right from Supply Chain Management UI:
- Go to Warehouse management > Setup > Process mining > Warehouse material movement process configuration.
- On the Action Pane, select Deploy process to open the deployment wizard and follow the on-screen instructions.
Note that for sake of integration with Power Automate Process Mining a staging table is created on the Supply Chain Management side. It contains data which is then read by Power Automate Process Mining. As part of the deployment wizard execution, the system will load only 200 cases (closed warehouse works) into the staging table and thus into the Power Automate Process Mining. Below we show how to load a full set of data.
After the successful deployment user will see a page like this:
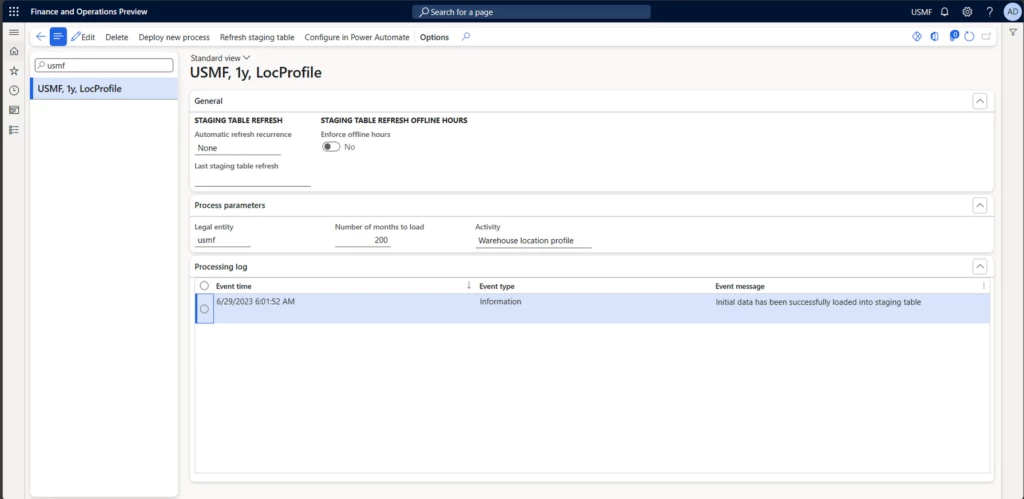
Here user can see the processing history – “Processing log” section will show events related to the staging table population and cleanup. Users can refresh the staging table manually by clicking the “Refresh staging table”. One can also set an automatic refresh schedule. But remember that it will only refresh data in the staging table in Supply Chain Management. After the staging table in Supply Chain Management is updated, you would normally want to refresh the Power Automate Process Mining process as well. You can do that by clicking the “Configure in Power Automate” button and trigger a refresh there (you can also setup an automatic refresh there as well).
You can find more details regarding the setup in the docs here: https://go.microsoft.com/fwlink/?linkid=2235867&clcid=0x409.
Let’s now see what insights you can get from this.
What kind of insights are available?
Take a look at this short video to get a feel of the possibilities:
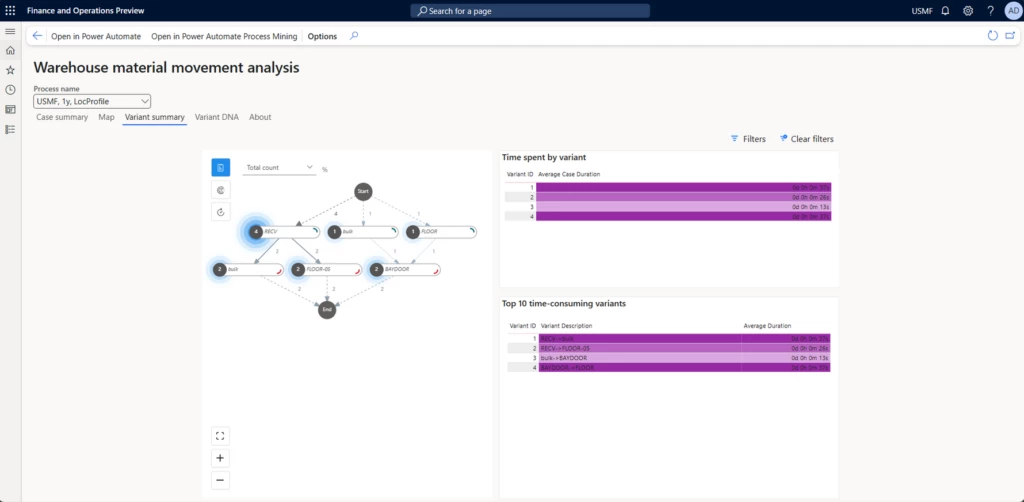
After the deployment is done, users can go to “Warehouse management > Setup > Process mining > Warehouse material movement process configuration” and view the process report.
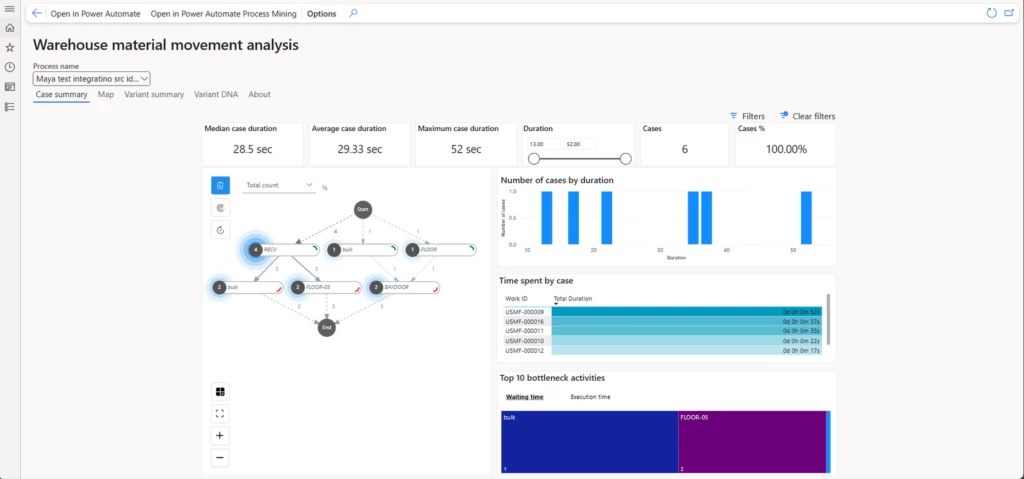
On the “Case summary” page one can get a quick overview of the material movements in the warehouse which can feed furthermore detailed investigation. The map control at the left basically shows you how material flows in the warehouse. Depending on your selection during the process deployment nodes can represent either Location Profile, Warehouse Zone or the Warehouse Location. On the map control you can choose if you want to look at frequencies or performance. Other KPIs on page are self-describing – they aim to give you an overview of the overall state of the process and also give you a feeling of the slowest cases (works) and activities (locations).
“Variant summary” and “Variant DNA” pages deal with the concept of variants. Several cases (works) could basically repeat the same route through the warehouse. Each unique route is a variant. So by looking at statistic related to variants you could find the most common ones and optimize for those. Or you could find unexpected outliers and further investigate the reason behind them.
But let’s take a sneak peek into a more advance process mining scenarios available with the desktop application. First you need to download and install it by clicking on the “Open in Power Automate Process Mining” button.
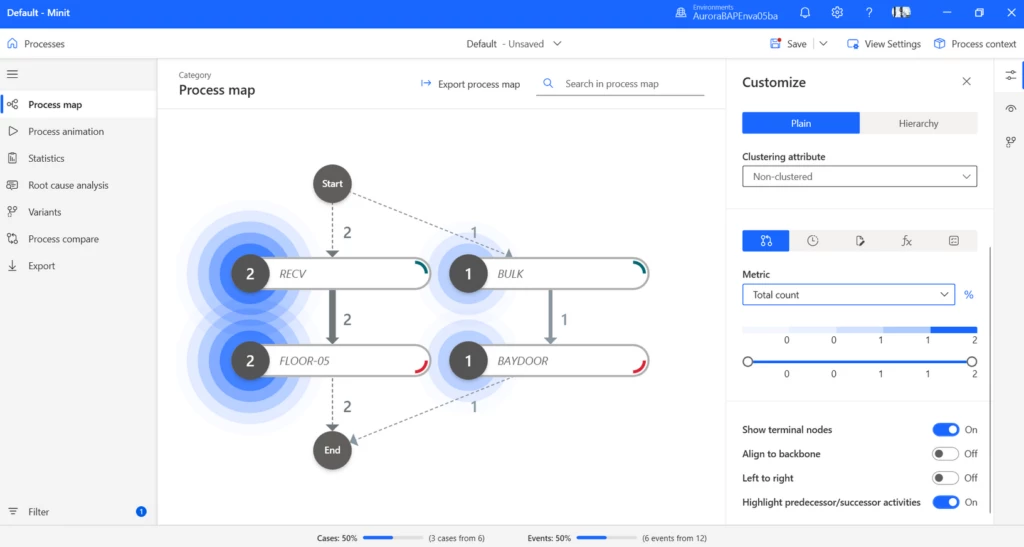
“Process map” visualization also is a prominent part of the tool. After all, it is very natural to represent processes as graphs. But here you have much richer possibilities about what metrics to show, how to highlight and cluster nodes:
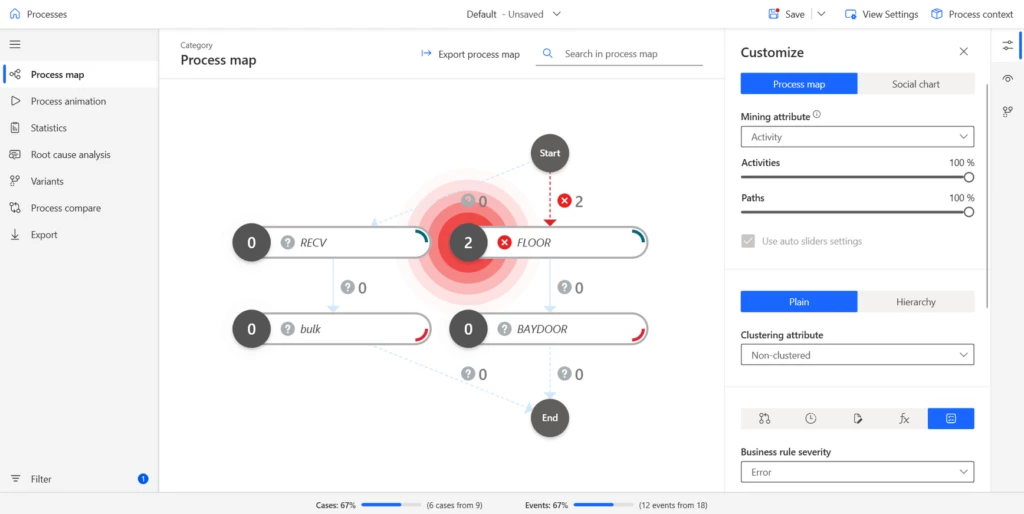
You could even define your own business rules which would influence the process map visualization by directly showing if process violates expected process behavior. For example, here I have created a business rule which highlights where short picking has happened:
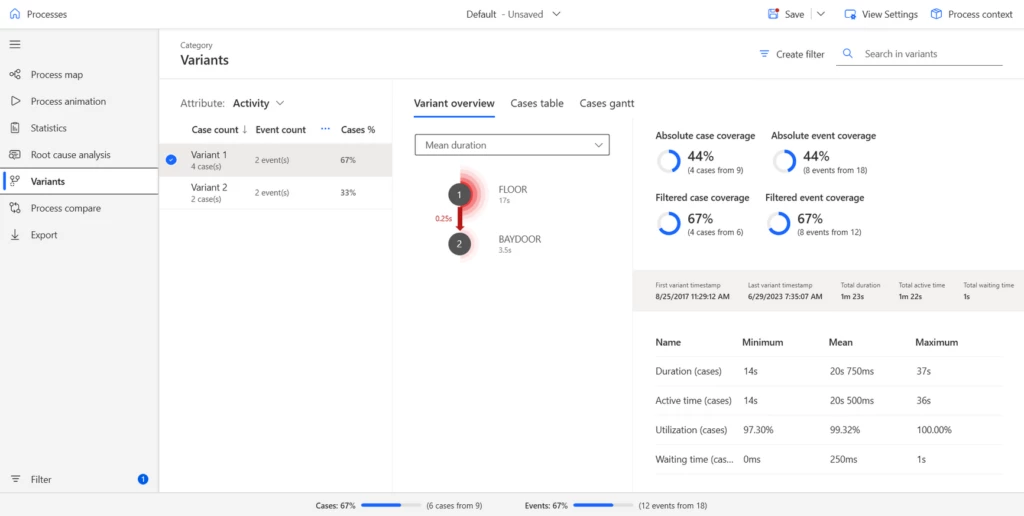
We have met the concept of variants when looking into the Power BI report. But in the desktop application you can get much more insights and statistics around the variants:
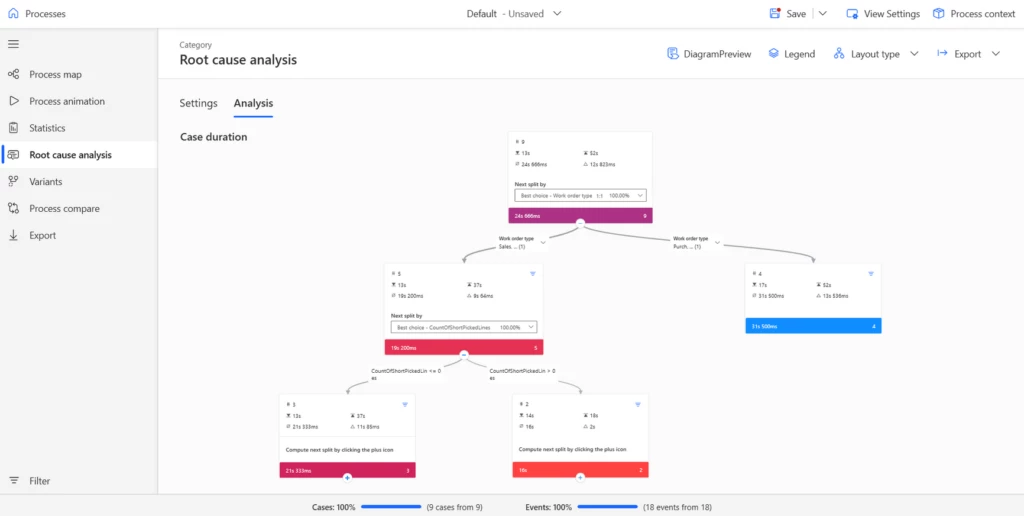
Most of the features we have seen so far are helping at discovering, visualizing and analyzing the processes. But AI powered Root Cause Analysis feature goes beyond that. It allows you to analyze what and how different business factors influence business process performance. For example, you may want to find out which factors are influencing warehouse work execution time the most. Remember though that tool requires the case level attributes to be used in RCA analysis. You can define your own custom metrics (like “Number of short picked lines”) and use those in the RCA.
Conclusion
Usage of Power Automate Process Mining for sake of getting insights into the warehouse material movement definitely enriches analytical toolset and allows to get insights which were pretty hard to get before.
To learn more about this feature and Supply Chain at Microsoft,
click below:
Feature Insights:
Supply Chain at Microsoft
Take a tour – Supply Chain Management | Microsoft Dynamics 365
We’re excited to launch Free Trial | Microsoft Supply Chain Center Preview , which harnesses generative AI to assist Supply Chain managers in real-time communication with suppliers regarding specific news