
In recent years, many developers have discovered the power of distributed tracing for debugging regressions and performance issues in their backend systems, especially for those of us with complex microservices architectures. But in many organizations, our most complex code may not be server-side code — it’s just as likely to be running client-side in a browser or mobile app.
While it’s still less common to see tracing instrumentation in client-side code, there’s no reason we can’t use it there. The high resolution, depth-first debugging capabilities tracing offers are useful regardless of where our code is running — and tracing in the client can give us a rich view of how users are interacting with our app. This article walks through a practical, incremental approach to using tracing-style instrumentation in client-side JavaScript apps.
Prerequisites
To get started, you’ll need:
- A web application that uses client-side javascript. I will show code from a React app using ES6 with Babel, but any app that includes more than a few lines of client-side javascript should work.
- A distributed tracing tool to view the data from your instrumentation. I’ll use io, but most modern distributed tracing tools, including open source options Zipkin & Jaeger, and other popular vendor tools like LightStep and AWS X-Ray, work too.
Other things that may be handy:
- Existing client-side instrumentation. If you are already sending page load timing metrics like navigation timing data to your monitoring & observability tooling, you may want to add these numbers as key/value pairs to your traces.
- A proxy endpoint in your own infrastructure. Some tracing tools will allow you to send traces directly to them from the browser, but proxying through your own infrastructure may be helpful so you can enrich your events with backend data (like a user ID, IP address, or team ID) without exposing that data to the client.
What does tracing data look like?
As you start instrumenting, it’s useful to have a mental picture of the shape of the data you will send. So what goes into a typical trace? A trace is composed of many spans (also called events). Each span represents one unit of work for a service, application, or piece of code. For example, a single database query or one HTTP request to a third party service might each be represented as a span. Spans can have parent-child relationships to each other, so you may see a trace representing an HTTP request to an app server; that trace may include a child span representing an HTTP request to an internal service, and then that child span might have many child spans of its own representing different database queries it triggered.
Here are some common types of fields you’ll see that help describe those spans:
- span ID: an arbitrary unique ID used to identify this particular unit of work
- trace ID: an arbitrary unique ID describing the trace this span is a part of. In a typical backend application, a trace might represent a single user HTTP request to a web application. In the browser, it’s more likely to represent a larger unit of work, like a page view.
- parent span ID: this field is used to draw a causal relationship between two spans. For example, if your web application makes an http request to a backend service that then triggers a database query, the span for the database query would use the span ID of the backend service span as its parent span ID.
- name: the particular type of work this span represents, e.g. “render json,” “select,” “save to S3,” etc.
- service name: the area of the codebase this span came from. In the browser, this might help you identify a particular package or area of your code (“router,” “redux,” “async renderer”).
- duration: the amount of time this particular unit of work took, in milliseconds.
Different distributed Tracing APIs use different field names, so check the docs of the tool or API you are using to find the right ones. OpenCensus and OpenTracing are great vendor-agnostic starting points if you aren’t sure which tracing tool you expect to use over the long term.
Sending your first span: page load
In backend applications, the root span — the span that represents the bounds of the whole trace — often maps to a single user request to your system. In the browser, it’s less clear what the root span should map to. A single request? A page view? A session? The single request option is too narrow for most use cases — it might help you spot a performance bottleneck, but it won’t do very much to help you understand how your users are experiencing your site. The page view and session options both will allow you to see sequences of user interactions instead of single atomic interactions. Choosing one or the other depends somewhat on the constraints of the tracing tool you are using. If navigating long time spans, e.g. minutes or hours, is difficult, a single page load may be better. If you have a single-page app, it may not make much difference which you choose, since users are likely to spend a whole session on a single page load. Some tools, including Honeycomb, allow you to choose which field to use as the trace ID field, so in that case, you may be able to send both and toggle between page-level traces and session-level traces in the UI.
In this case, we’ve decided each trace will represent a single page load. We need a few pieces of code to send our first span (the root span) and thereby start a trace.
First, you’ll want a reusable function to handle the mechanics of sending spans. This is ours:
// Generates random string ID like "2147483648" for each span in a trace.
const newSpanID = () => Math.floor(Math.random() * 2 ** 31).toString();
const traceID = newSpanID();

export default class Tracing {

 sendSpan(spanName, metadata, duration, isRootSpan) {
   const params = {
     name: spanName,
     service_name: metadata.serviceName,
     duration_ms: duration,
     "trace.trace_id": traceID,

     // If no parent ID is passed, just attach to the root span
     "trace.parent_id": isRootSpan ? null : (metadata.parentID || traceID),
     "trace.span_id": isRootSpan ? traceID : newSpanID(),

     // Send the current state of all feature flags with each span
     ...flags,

     // Send the rest of our fields
     ...metadata,
   };

   // Use the Beacon API to send spans to our proxy endpoint, so we don't
   // have to worry about missing spans if the user navigates while sending.
   navigator.sendBeacon(`/create_span/`, JSON.stringify(params));
 }
}
Then, you’ll need to add code to create your span on page load. It not only adds an on-load listener to create and send the event, but also handles capturing some client metadata and performance data about the current page.
// Start a trace every time someone loads a Honeycomb page in the browser,
// and capture perf stats about the current page load.
// Assumes the presence of a `window.performance.timing` object
const pageLoadMetadata = function() {
 const nt = window.performance.timing;
 const hasPerfTimeline = !!window.performance.getEntriesByType;
 totalDurationMS = nt.loadEventEnd - nt.connectStart;

 const metadata = {
   // Chrome-only (for now) information on internet connection type (4g, wifi, etc.)
   // https://developers.google.com/web/updates/2017/10/nic62
   connection_type: navigator.connection && navigator.connection.type,
   connection_type_effective: navigator.connection && navigator.connection.effectiveType,
   connection_rtt: navigator.connection && navigator.connection.rtt,

   // Navigation timings, transformed from timestamps into deltas (shortened)
   timing_unload_ms: nt.unloadEnd - nt.navigationStart,
   timing_dns_end_ms: nt.domainLookupEnd - nt.navigationStart,
   timing_ssl_end_ms: nt.connectEnd - nt.navigationStart,
   timing_response_end_ms: nt.responseEnd - nt.navigationStart,
   timing_dom_interactive_ms: nt.domInteractive - nt.navigationStart,
   timing_dom_complete_ms: nt.domComplete - nt.navigationStart,
   timing_dom_loaded_ms: nt.loadEventEnd - nt.navigationStart,
   timing_ms_first_paint: nt.msFirstPaint - nt.navigationStart, // Nonstandard IE/Edge-only first pain

   // Entire page load duration
   timing_total_duration_ms: totalDurationMS,

   // Client properties
   user_agent: window.navigator.userAgent,
   window_height: window.innerHeight,
   window_width: window.innerWidth,
   screen_height: window.screen && window.screen.height,
   screen_width: window.screen && window.screen.width,
 };

 // PerformancePaintTiming data (Chrome only for now)
 if (hasPerfTimeline) {
   let paints = window.performance.getEntriesByType("paint");

   // Loop through array of two PerformancePaintTimings and send both
   _.each(paints, paint => {
     if (paint.name === "first-paint") {
       metadata.timing_first_paint_ms = paint.startTime;
     } else if (paint.name === "first-contentful-paint") {
       metadata.timing_first_contentful_paint_ms = paint.startTime;
     }
   });
 }

 // Redirect Count (inconsistent browser support)
 metadata.redirect_count =
   window.performance.navigation && window.performance.navigation.redirectCount;

 return metadata;
};

window.addEventListener("load", () => {
   _userEvents.pageLoad(pageLoadMetadata(), totalDurationMS);
});
The duration field on this span presents an interesting dilemma. Do we want it to represent just the work of initially loading the page, or should it represent the entire time the user spent viewing the page? In this case, I chose the former, because initial page loading is something I’m very interested in quantifying. I will also send a final span when the browser fires its “unload” event to help us capture the time spent viewing the page. However, if your tracing tool doesn’t have good support for displaying asynchronous spans — spans that have a start time or duration that push them outside the bounds of the root span — you may want to instead send this page load span on unload and have its duration represent the entire time spent viewing the page.
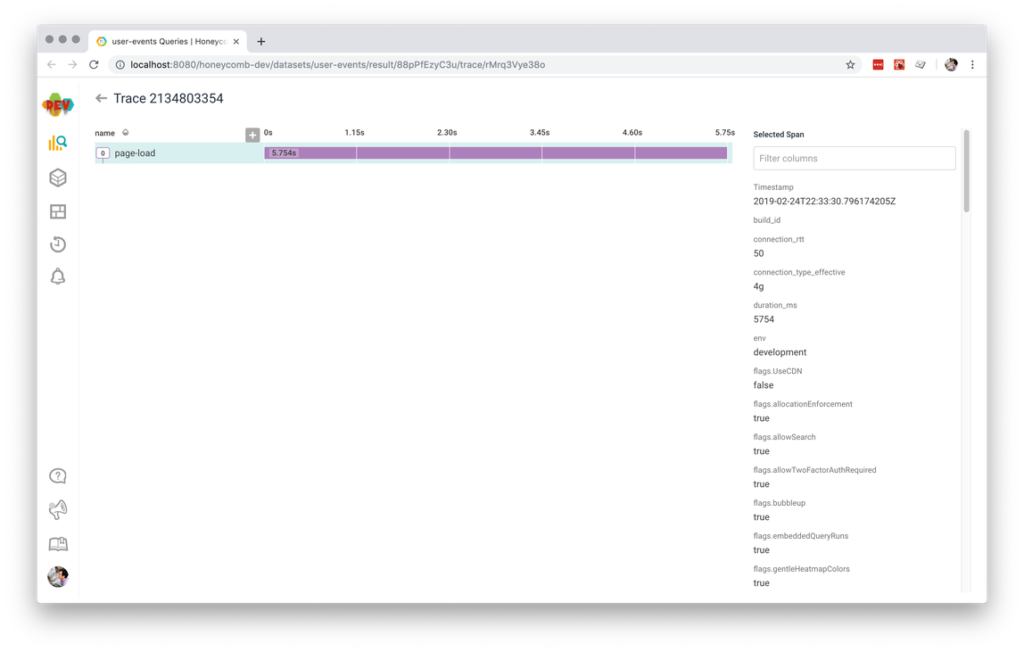
This gets us one span, which is both an “event” and a “trace!” It’s not very interesting, though. While it might tell us whether a particular page load was fast or slow, it doesn’t help us understand much about the user’s experience on that page. So let’s add more spans!
Tracking browser events
What else can we add to this trace view? One option that will help us get a higher-fidelity picture of our user experience is adding a span each time a user triggers an interesting event like a mouse click or a tap. If you already send custom events to a product analytics tool, these are often the exact kinds of events you want to capture. For example, this app sends product analytics events to both Amplitude and Honeycomb, so the easiest thing to do is have our analytics code also call our sendSpan function defined above. In our case, that gets us lots of events:
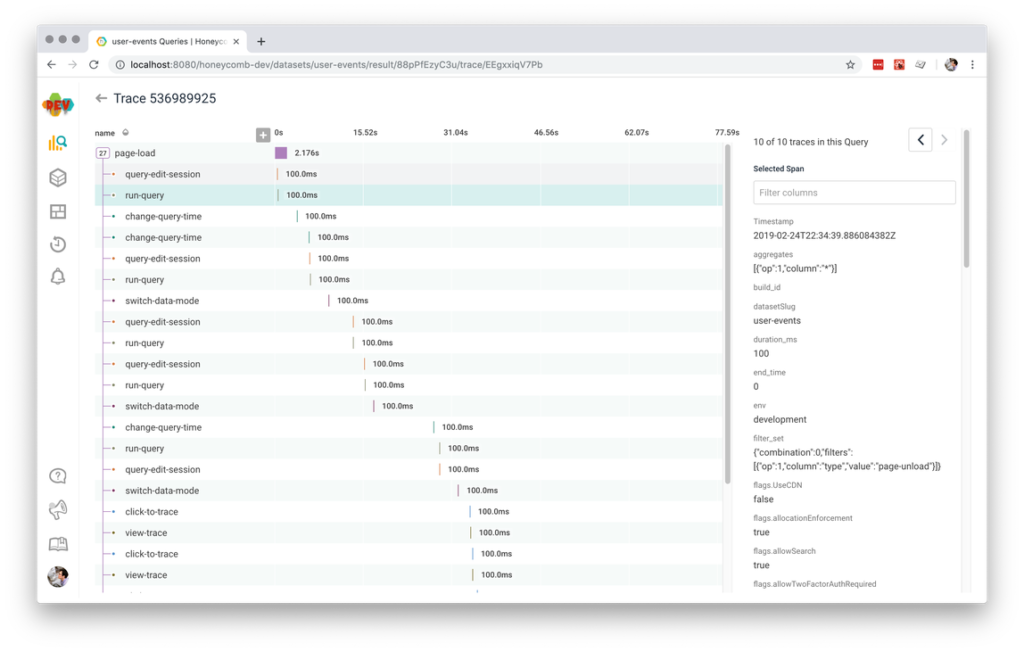
We’ve included a default duration of 100ms to make sure all of these show on the waterfall view, but in an ideal world we would use the duration to track the time it took the browser to bubble the event, call the event handler, and render any resulting changes.
If you don’t have existing product analytics instrumentation to hook into, you can always start by setting up event listeners for interesting events like clicks. Here’s a simple example of what that code would look like — in a real app you might want to add some logic to filter for only the most interesting click targets.
const t = new Tracing();

// Adds a span to our traces for each user click
document.addEventListener("click", e => {
 const start = window.performance.now();

 // Wrap in a setTimeout so the duration includes the running time of the
 // relevant event handler & related page updates.
 setTimeout(() => {
   const duration = window.performance.now() - start;

   t.sendSpan("click", {
     clickTargetClass: e.target.className,
     clickTargetID: e.target.id,
   }, duration);
 }, 0);

// Use click capture so we can record the start time closer to the user's action
}, true);
Some of our most interesting cases to track will be cases where a user interaction — like clicking a button — triggers an http request — like submitting a form via xhr. If possible, it’s also good to track xhr requests, plus any response process and DOM mutation that result, as spans too. In our React app, we can use our requests module and life cycle callbacks like componentDidUpdate to do this, but the exact patterns will vary from app to app.
Tracking errors
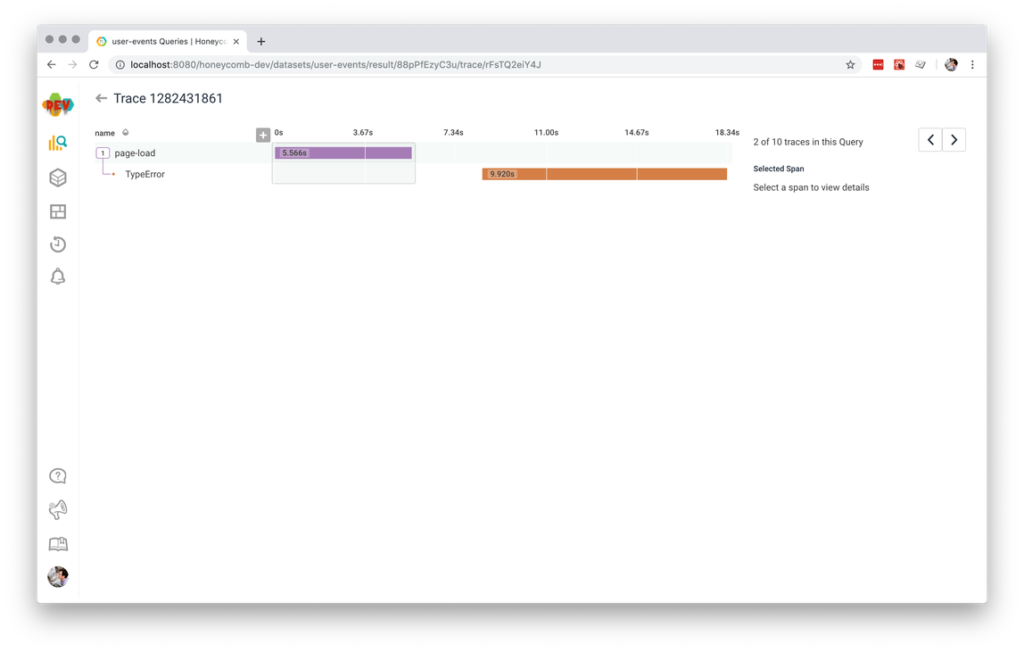
Even though our team uses a dedicated error monitoring tool (something like Sentry, Bugsnag, Airbrake, etc.) with this app to give us a more convenient team workflow for finding and fixing errors, we still want to see errors in our traces too. This will help us understand if a user’s experience might be unsuccessful or slow because of a preventable JavaScript error. That way if a user loads a page and then immediately leaves, we can guess if they left because something went wrong, or because they didn’t find what they were looking for.
If you do use a dedicated error monitoring tool, consider adding a few custom fields to your error reports: your tracing spanID and a link to your tracing tool that will allow you to query for this particular span. That will let you easily jump from your error monitoring tool back to your tracing tool if you find you want to better understand the context around a particular error.
const t = new Tracing();

// Sends a span each time an error happens in the browser
window.onerror = (message, source, lineno, colno, error) => {
 const start = window.performance.now();
 const spanID = newSpanID();

 // Send a unique ID to our error monitoring service AND add a reference back
 // to this span, so we can cross-link easily between tools.
 recordError(error, {
   honeycombSpanID: spanID,
   viewHoneycombTraceURL: `https://example.com/link/to/our/trace/${spanID}`
 })

 t.sendSpan("error", {
   spanID: spanID,
   name: error.name,
   "error.message": message,
   "error.source": source,
   "error.lineno": lineno,
   "error:colno": colno,
 }, window.performance.now() - start);
};
Tracking navigations
Finally, our React app includes some single-page-app-style behavior, where large portions of the page will change without doing a full browser navigation. These kinds of page changes are great things to track in our traces, because they help us understand how users are navigating around our app.
If you’re using a client-side routing solution that lets you fire a callback every time the user performs a navigation, that’s a great place to send a span. for the rest of us, we’ll need to shim calls to history-changing functions like pushState and replaceState to get them to do our bidding. Here’s an example:
const t = new Tracing();

// Shim the browser's native pushState function
const pushState = history.pushState;

// Send a span for each pushState call
history.pushState = function (stateObj, title, location) {
 const lastPage = window.location.pathname;

 // Call through to the old pushState so the location/history actually changes
 pushState.apply(history, arguments);

 // Wrap in this in a setTimeout so the duration includes the running time of
 // related page updates.
 setTimeout(() => {
   t.sendSpan("pushState", {
     lastPage,
     newPage: location,
   }, duration);

 }, 0);
};
Between events, navigations, and errors, we have a record of all the major things a user did while navigating our page. Not bad!
This is a great starting point that will give us a high-level overview of users’ interactions with each page of our app. As we find other significant interaction categories, we can add a span for each one.
Privacy
While sending client-side telemetry like performance metrics, errors, and product analytics to your application server or third-party tools has been a standard practice in the industry for many years, tracing data usually presents a higher-fidelity view of user behavior than was available in the prior generation of tools. Tracing-style tools also often have better support for high cardinality querying, meaning it can be easier to associate a particular set of behaviors with an individual IP addresses or person. This higher-fidelity view into users’ activity brings with it new potential user privacy concerns.
Some suggestions:
- Consider whether a particular piece of metadata will truly be helpful for debugging or understanding user experience before you include it in your traces. Is there a less-revealing field value that could do the same work?
- Avoid sending extra user & application metadata to the client just to be included in instrumentation. Instead, pipe tracing data through your own infrastructure to enrich it there, rather than exposing that data client-side where third-party scripts may also have access to it.
- Check the data retention policies & data access practices of your third-party vendors, if you are sending your tracing data outside your own systems. Do they support sending and storing PII? In what circumstances are they able to access your data, and for how long?
Learn More
Sending distributed tracing-style instrumentation from the browser is still a relatively uncommon practice, and we are still finding new patterns and figuring out the best practices as a community. If you’re interested in seeing more approaches to browser tracing and client-side instrumentation, check out:
- opentracing-javascript: an Open Tracing API implementation in javascript, suitable for both Node.js and browser applications
- zipkin-js: a library to do Zipkin-style tracing instrumentation in both Node.js and browser applications
- an older blog post on our prior approach to browser instrumentation at Honeycomb, pre-tracing.
If you have questions or suggestions from your own client-side tracing, let us know in the comments! Happy tracing.