
This blog dives into monitoring-as-code ad adding automated performance quality gates into your software delivery pipelines. We’ll walk through examples using a web microservice app and an Azure function app that we developed as open source services that help you qualify the overall performance and quality of applications. Both services utilize the Keptn Pitometer open source Node.js that gather and evaluation a provided performance specification which will be covered too.
What is Monitoring-as-Code?
Automated performance quality gates aim to eliminate the reliance on manual performance and architecture quality reviews following a deployment. Using a “Performance Specification” (PerfSpec) file, which defines performance and architecture metrics to query during pipeline execution, allows the collection and evaluation to be automated. Having such a PerfSpec file that is version controlled next to your source code follows the “everything-as-code” and GitOps approach. Note: A more detailed background and overview of the PerfSpec concept is explained by Andi Grabner in his recent blog Performance as Code at Neotys PAC leads to Pitometer in.
What are use cases for Monitoring-as-code?
- Continuous performance feedback: by collecting these metrics in an automated and consistent way, the PerfSpec result provides continuous performance feedback to engineers, allowing them to define what information they are interested in and control that information using source control repositories such as GIT.
- Quality gates: by adding threshold criteria for each defined metric, these same metrics can be used to stop the code delivery pipeline by adding rules to determine “pass” or “fail” for the pipeline stage. We refer to these as quality gates and they provide the benefits of:
-
- enforcing standards
- eliminating manual review of logs and dashboards for every build
- increasing confidence for build quality
- allowing the team to receive targeted information for triaging issues
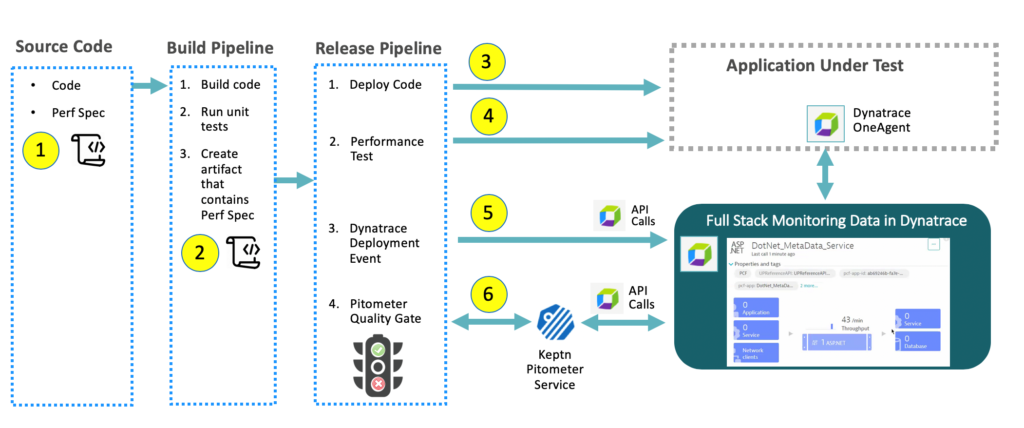
The diagram below expresses this concept:
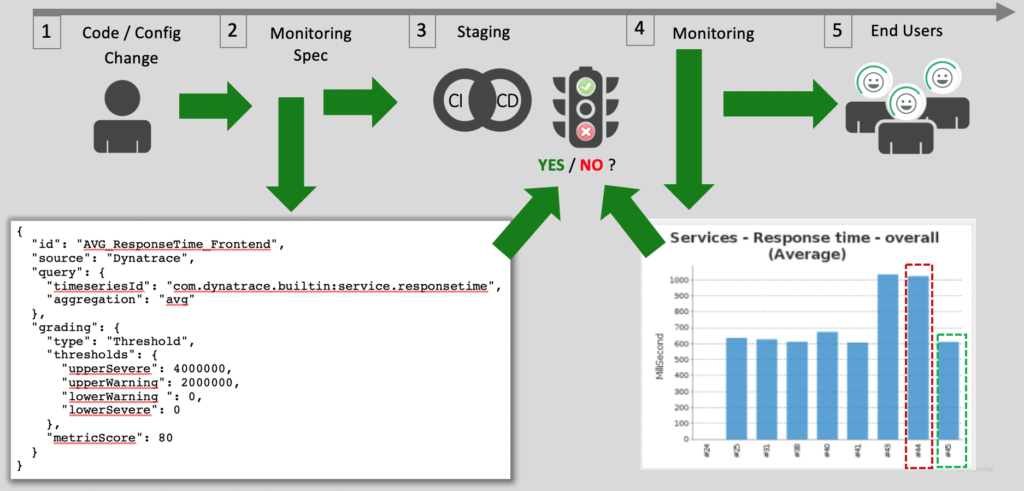
3. Automated deployment / Canary validation: the use of a PerfSpec is not limited to code delivery pipelines. Following a deployment to an environment, health check queries can be made using a PerfSpec to determine if all is well with the application. This is perfect for Canary deployment models where these metrics can inform the decision to enable the feature to all users or turn it off.
These are just a few use cases for inspiration. See the 2019 Performance Advisory Council presentation slides for additional ideas “Performance as Code – Let’s Make it a Standard.”
Getting started with Pitometer
Pitometer is an open source project that is designed to qualify an application or service by using a well-defined performance specification. This performance specification file, referred to as PerfSpec, is a declarative way to define which metrics to monitor. Pitometer will parse the PerfSpec, pull the specified metrics, evaluate them, and give you a pass, fail, or warning result for each metric, as well as across all metrics where Pitometer calculates a total observation score.
Pitometer is not an application, rather a set of several Node.js modules that one needs to include and incorporate within a custom Node.js client. Pitometer libraries are modular with extensible metric sources and graders. Right now, there are source modules for Dynatrace and Prometheus and a grader for thresholds, but it’s easy to write new sources and graders.
We have developed two open source Pitometer client implementations that can be easily implemented within your CI tool, whether it be Jenkins, Azure DevOps, Bamboo, or something else.
- The first implementation is a Dockerized webservice that can be deployed to your desktop, any VM running Docker, Azure container application, or Kubernetes
- The second implementation is an Azure function application for a serverless option as Azure
Both implementations accept an HTTP POST request to the service with these elements in a JSON structure.
Pitometer client processing example
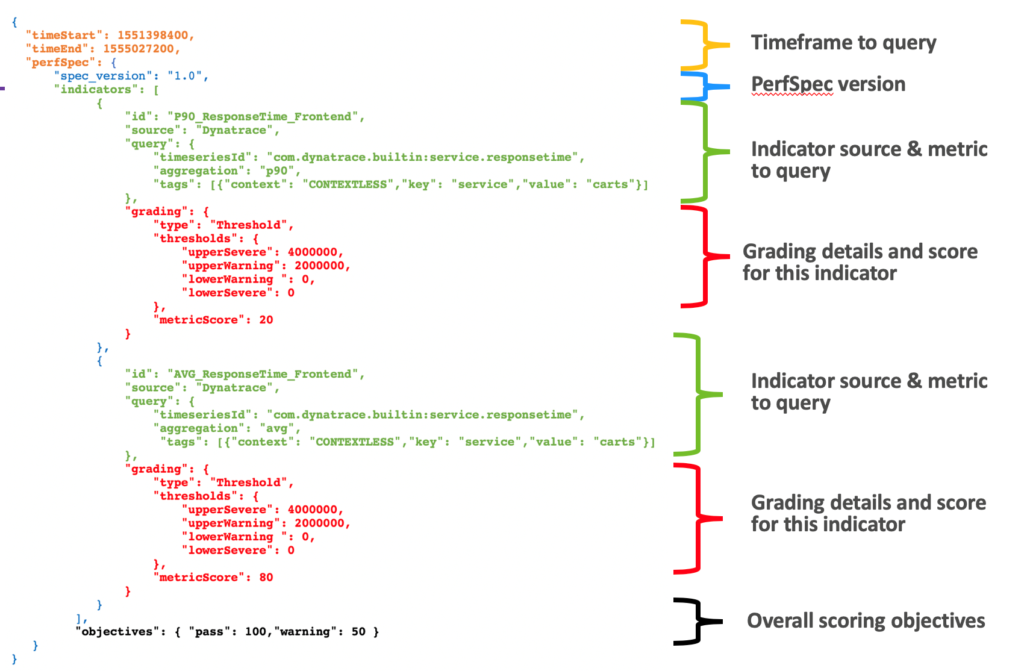
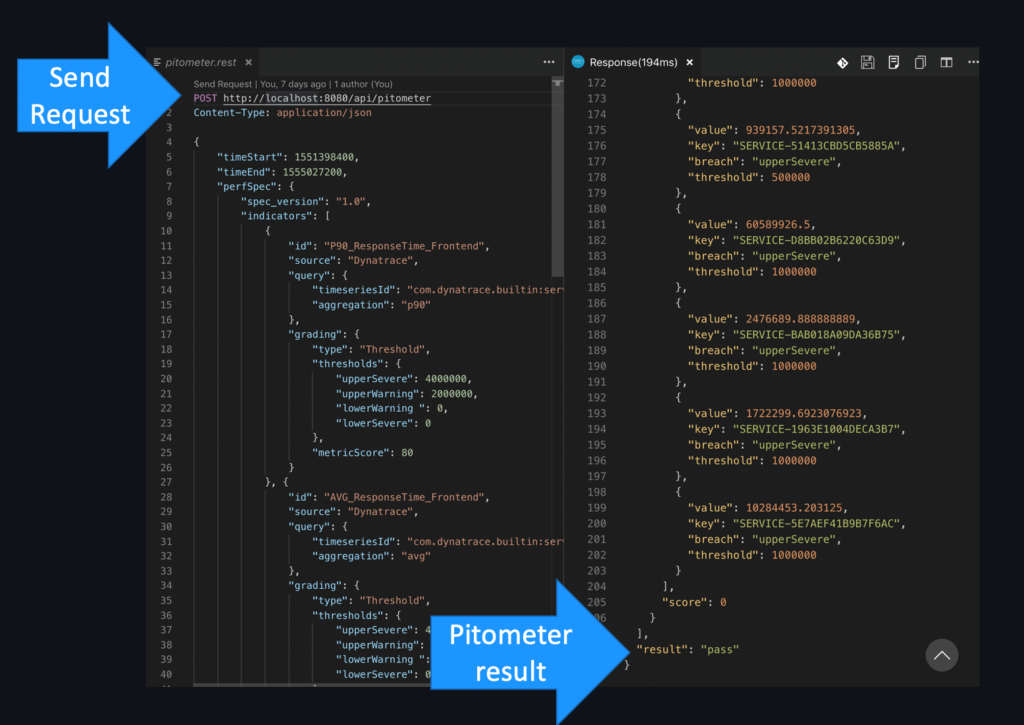
This example POST request defines the start/stop time frame of the request along with the PerfSpec comprised of two indicators. Each indicator defines the sources as Dynatrace, the query of the metric sought, grading thresholds, and metric score. At the end of the request is an overall “PerfSpec” objective.
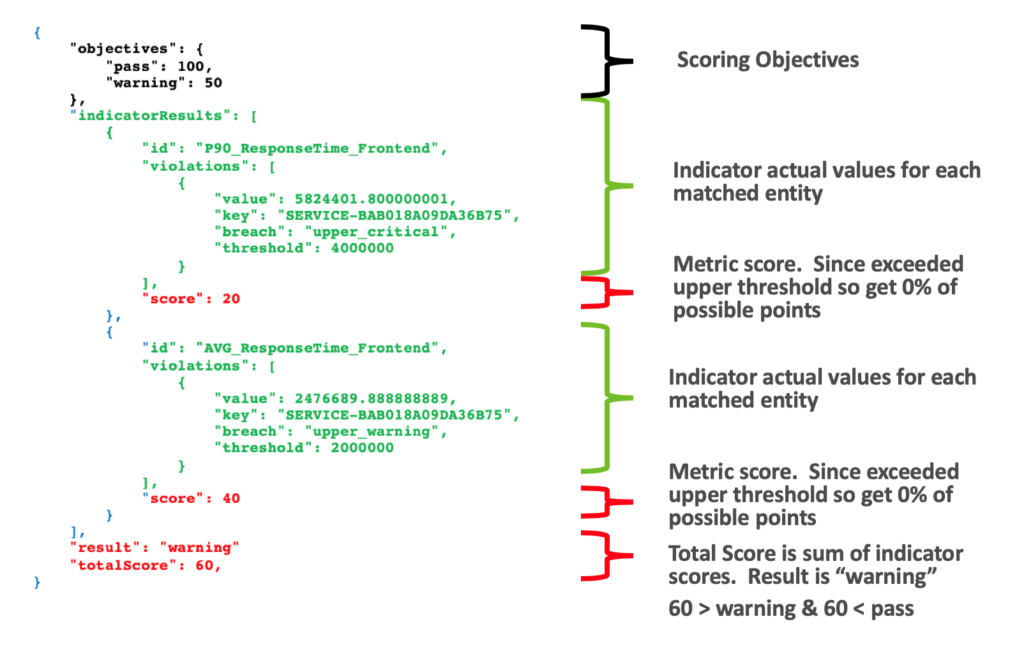
The HTTP response is a JSON body with a result of “pass,” “warning,” or “fail.” In our example response below, the sum of the indicator scores is between the pass and warning overall objectives, so the PerfSpec result is a “warning.” If there were no violations, then the indicator would receive the total metricScore and the violations array would be empty.
Try Pitometer locally
Follow these steps to call Pitometer using a PerfSpec from your laptop.
- To provision the resources to host your application and configure these resources with the Dynatrace OneAgent for monitoring, click here for a Dynatrace Free Trial. See these instructions for how to generate the Dynatrace API token that Pitometer requires.
- With Docker installed, just do a “docker pull” of the pre-built Pitometer webservice image. See these instructions for how to configure and run Docker locally.
- Using a tool like Postman or VS Code with the “REST client” extension, open an example REST file.
You will need to adjust the start/stop times and then send the POST request to http://localhost:8080/api/pitometer
Implementing Pitometer quality gate in a pipeline
Below is a how to add a PerfSpec and quality gate using Pitometer into you code delivery pipelines.
Follow these steps to add a quality gate using the “PerfSpec” file and Pitometer:
- To provision the resources to host your application and configure these resources with the Dynatrace OneAgent for monitoring, click here for a Dynatrace Free Trial. See these instructions for how to generate a Dynatrace API token that Pitometer requires.
- Provision the resources to host the Pitometer service and deploy Pitometer to it. There are multiple ways to deploy the Pitometer implementations such as:
-
- Docker in a VM
- Docker in a Azure container service
- Docker in Kubernetes
- Azure function application
See the README in the Pitometer web service and Pitometer Azure function GIT repo for more details.
- Create a “PerfSpec” file and check it into your source code repo. Note: there is an example PerfSpec file in the Pitometer reference implementation GIT samples folder
- In the build pipeline, add a task that will add the “PerfSpec” as a built artifact
- In the release pipeline import the build artifact. Then before the load test step, save the timestamp into a variable. After the load test, save timestamp into a variable. Then call the Pitometer service with the start and stop timestamp and the PerfSpec file contained in the artifact.
Next steps
We envision the either the Pitometer web services or Pitometer Azure function application to be great for demos of monitoring-as-code and how-to building resiliency in your software delivery pipelines.
Our example services are stateless and will scale to support multiple build pipelines for a given business critical application and shared service across applications and teams. The code is open source, so feel free to extend it to support other use cases and share back what you did.
Please see the README files in these Pitometer example projects for more details to get started.
- Pitometer web service – https://github.com/dt-demos/pitometer-web-service
- Pitometer Azure function – https://github.com/dt-demos/pitometer-azfunctions
If you have any questions or feedback, please leave a comment below. Also, be sure to check out our next blog post: Five steps to add automated performance quality gates to Azure DevOps pipelines.