
Analytics Reports: Visualize your recruiting pipeline with Dynamics 365 for Talent
We are excited to announce Job Analytics and Analytics Hub capabilities are now available in the Dynamics 365 for Talent: Attract public preview. These new capabilities use Power BI Embedded to provide your hiring teams with insight into recruiting pipelines. Get powerful analytics with cross-filtering, row-level security, and data refreshes—right out of the box—all you need is Dynamics 365 for Talent, with the comprehensive hiring add-on license. To learn more about using this feature, check out our documentation.
Job Analytics
Job Analytics reports are a snapshot of the hiring process for a job. If you have Admin, Read All, Hiring Manager, or Recruiter permissions for a job, you will see the new Analytics tab when viewing job details.
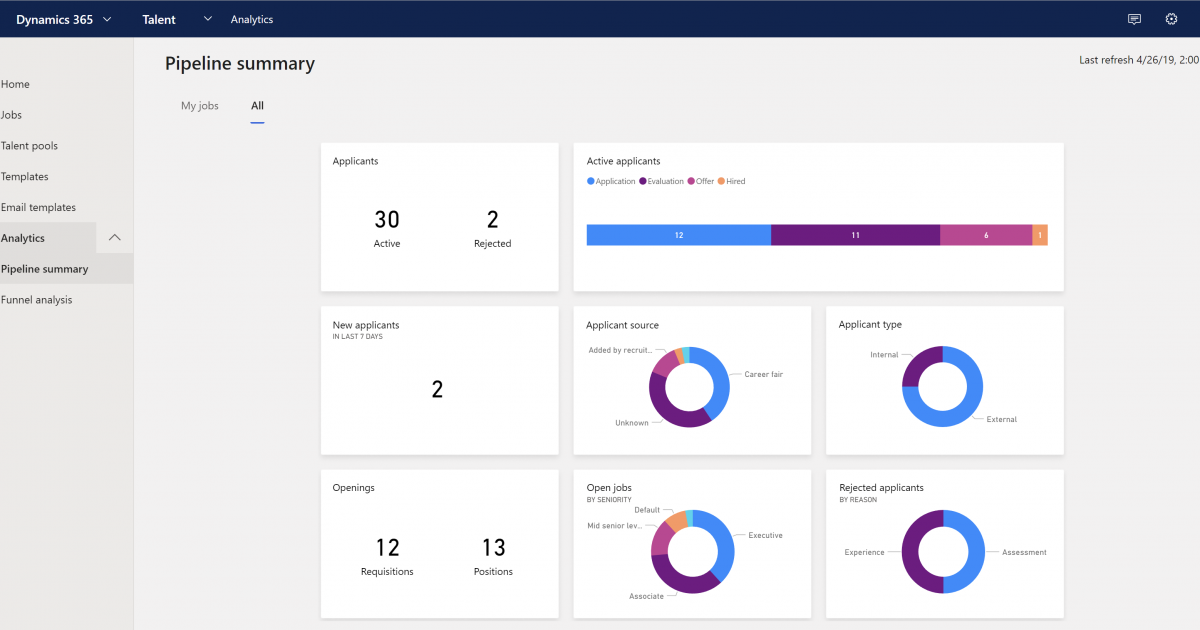
Analytics Hub
Analytics Hub reports aggregate job data to surface trends in the hiring process. Users with Admin, Read All, Hiring Manager, and Recruiter permissions will see Analytics on the navigation menu on the left. The following screenshots show sample Analytics Hub reports.
Interact with your reports
You can now hover over visuals for additional information. For example, hovering over Active applicants visuals will display the average days in stage. Analyzing this info can provide insights that are critical to reducing time to hire and enable recruiters to focus on ways to reduce the time spent in each stage.
Cross-filter
One of the great features of Power BI is the way all visuals on a report page are interconnected. If you select a data point on one of the visuals, all the other visuals on the page that contain data change based on that selection. Find out more and see an example in How visuals cross-filter each other in a Power BI report.